Dundas BI
- Business Analytics Tools
- Big Data Analytics Tools
- Big Data Visualization Tools
- Business Intelligence Tools
- Cloud BI Solutions
- Data Analytics Software
- Data Cleaning Tools
- Data Discovery Tools
- Data Integration Tools
- Data Management Tools
- Data Preparation Software
- Data Warehouse Tools
- Ecommerce Analytics Software Tools
- Embedded Analytics Tools
- Enterprise Reporting Software
- ETL Tools
- HR Analytics Software
- OLAP Tools
- Predictive Analytics Software
- Qualitative Data Analysis Software
- Self-Service BI Tools
What is Dundas BI?
Industry Specialties: Serves all industries


Dundas BI Pricing
Based on our most recent analysis, Dundas BI pricing and cost details are described here:
- Price
- $$$$$
- Starting From
- $2500
- Pricing Model
- Monthly, Quote-based
- Free Trial
- Request for Free
Training Resources
Dundas BI is supported with the following types of training:
- Documentation
- In Person
- Live Online
- Videos
- Webinars
Support
The following support services are available for Dundas BI:
- Phone
- Chat
- FAQ
- Forum
- Knowledge Base
- 24/7 Live Support
Dundas BI Benefits and Insights
Key differentiators & advantages of Dundas BI
- Get Two for the Price of One: The vendor provides dashboards and reporting in one package without charging extra. Periodic data refreshes don’t cost extra.
- Analyze Complex Data Volumes: Leave no data behind, including text and location-based data. Derive actionable insight from sentiment analysis of user feedback. Forecast market trends and business performance with statistical analysis and what-if scenarios, which include geospatial information.
- Obtain Live Insight: Set up visualizations to update on demand or per schedule automatically. Build new dashboards by connecting visualizations and datasets from other dashboards via filters.
- Build Custom Reports: Display the desired information on the fly with customizable reports. Define headers and footers, nested groups and repeating groups within reports. Integrated version control prevents users from creating data silos with local copies. Share reports via email or third-party API calls.
- Integrate With Multiple Platforms: Extend the analytics ecosystem by connecting with iFrames, Javascript API frameworks, Python, R and JDBC, and ODBC connectors. Choose from over 25 built-in connectors and integration APIs, and connect to OLAP, big data, RDBMS, flat files, web services and more.
- Gain Data Access on the Go: View mobile dashboards, scorecards and reports on any device — iOS, Android, Windows and Blackberry. A responsive, touch-optimized design lets users zoom in and out for deep-dive analysis.
- Manage Data: Perform end-to-end data management, supported by OLAP and multidimensional analysis. Drag and drop metrics, procedures, functions and OLAP cubes into the dashboard without defining each element. Workflow components are modular and reusable.
- Maintain Data Quality: The vendor provides a rich toolkit for data correction, enrichment, scripting, parsing, profiling, quality check and security. Users can change incorrect metrics via the interface with admin-granted permissions.
- Collaborate: Avoid data silos with decentralized analytics and information sharing across workspaces. Culture-aware settings and data formatting help boost software adoption in distributed teams.
- Keep Data Secure: Monitor app usage and performance via a centrally accessible dashboard. Audit trails, authentication protocols, row and column-level access restrictions and data encryption assure data quality. The software supports SSO, SAML 2.0, OpenID Connect, Kerberos and Active Directory and works with LDAP and Office 365.
Industry Expertise
Dundas BI Reviews
Average customer reviews & user sentiment summary for Dundas BI:

589 reviews
Synopsis of User Ratings and Reviews
Based on an aggregate of Dundas BI reviews taken from the sources above, the following pros & cons have been curated by a SelectHub Market Analyst.
Pros
Cons
Researcher's Summary:
Key Features
- Open Architecture: Work with any browser by leveraging JavaScript, HTML5 components, CSS3 and animated interactive visualizations in the embedded BI framework. View the platform on any device without any apps or downloads.
- Add functions, transforms, controls, visualizations, data providers and export, and delivery providers.
- Automate workflows to trigger when metrics exceed pre-defined values.
- Customize the platform with vendor-provided SDKs with Eclipse and Microsoft Visual Studio support. Build calculated element transforms, bridge parameters and formula scripts with DundasScript.
- Embedding: Perform analysis, reporting, data transformation, dashboard and mashup designing within business systems. Embed a screen or the entire application via iFrames or its Embed library. The software fully supports custom integration into other applications with server and client APIs, SSO and authentication support.
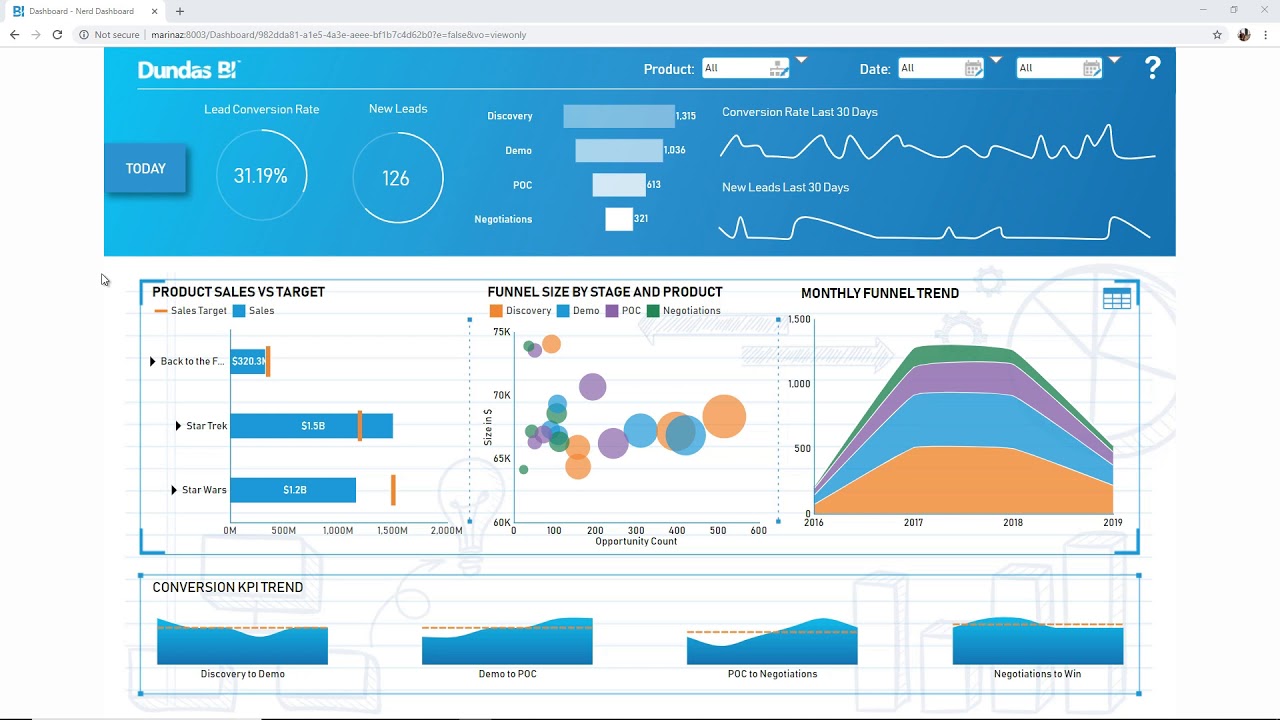
- Dashboards: Create pixel-perfect dashboards with various visualization types that include bar graphs, scattergrams, pie charts, line graphs, radar charts, scorecards, trellis charts and maps.
- Pre-built Templates: The vendor offers the option to pre-build dashboard templates and customize them as needed. Changing any template element applies the modifications in all linked dashboards.
- Pre-designed Widgets: The tool offers pre-defined widgets as dashboard building blocks. Modify, duplicate and delete them as necessary.
- Animations: Show changing levels and scales by adding animations to visualizations. Animate more than just the data – the software's web design allows animating diverse dashboard components like images and visuals. Developers can animate any dashboard element using built-in scripting.
- Segment Analysis: Perform segmentation through its built-in period-over-period analytics functionality. Other techniques include slicer comparisons, the Group Members option, formulas and calculated elements.
- What-if Analysis: Perform scenario analysis by inputting desired values into ready-to-use formulas. Pre-prepare them by substituting placeholder parameters for variables and connecting them to numeric inputs or sliders.
- Regression Analysis: Predict future values by applying its trend and forecasting function to time series. The software provides four regression functions: linear, exponential, logarithmic and power. Additionally, exponential smoothing assists in time-series analysis and forecasting.
- Statistical Functions: Calculate correlation, percentile, normal distribution, simple standard deviation and variance. The software provides Bollinger bands, moving averages, median, mode, k-means clustering and distance functions.
- Data Modeling: Explore data with intuitive user actions – drag and drop columns to create multi-level hierarchies or time dimensions. Or build data models from pre-prepared data cubes for additional transformations. The platform integrates with Microsoft SSAS, SAP NetWeaver BW 7.0+, Microsoft PowerPivot and Oracle Hyperion Essbase 11.
- Data Cubes: Analyze any data type with Dundas' data cubes — turn regular columns into dimensions, hierarchies and measures. Dragging metrics directly from a source automatically generates a data cube for instant analysis.
- Decentralized Analytics: Offers decentralization at the organizational, multi-tenant and warehouse levels.
- Choose to keep the data objects, connectors, dashboards and reports isolated from other business processes with organizational decentralization.
- It’s built to fit into a multi-tenant environment — tenant content is exclusive, while global content sharing is optional.
- At the warehouse level, tenants can opt to store their data separately.
- Globalization: The platform features settings to define the user's language, country and data viewing preferences. It includes culture-sensitive formatting of numbers, dates, times and currency. The system identifies the user's location and displays numbers and dates accordingly.
- Intuitive Visualizations: The platform offers tooltips to display measures and labels when users click on them or hover over a visualization.
- Interactivity: Derive actionable insight with easy user actions like navigating, filtering, toggling template cells, scripting, and inputting and correcting data.
- Visualization Types: Display dataset associations with Sankey, tree, chord and relationship diagrams. Advanced formula-based visualizations include Pareto charts, histograms, correlation matrices, parallel coordinates charts and forecasts.
- Activity Tracking: Monitor user activity across projects and dashboards. Every BI instance can locally record usage data, such as which metrics users viewed and for how long.
- Built-in Alerts: Get alerts when users add notes to metrics sets or data changes. Additionally, the system issues notifications when a user adds a measure correction to a metric set.
- Maps and Geospatial Visualizations: The platform supports visualizing location data with choropleth maps, dot distribution maps, heatmaps and more.
- Add map elements with built-in shapes, paths and symbols, or import ESRI shapefiles from the web.
- Add location details to the zip code or street address by leveraging its integration with Bing Maps, ArcGIS, Carto, OpenStreetMap and Mapbox, among others.
- Workspaces: Manage dashboards, visualizations and reports in one place with exclusive workspaces. The vendor provides a built-in project <GLOBAL> to store images, maps, diagrams, styles and themes in a centralized repository.
- Pinboards: Display data from separate dashboards by collecting individual widgets into a pinboard. Duplicate, modify and delete them as necessary.
- Integrations: The platform supports standard file formats, including CSV, PDF, Excel, text and HTML.
- Fully supports Apache Hive, Spark SQL, Google BigQuery, Salesforce, Microsoft Dynamics, HubSpot, SQL Server, MySQL, PostgreSQL and IBM DB2. Integrates seamlessly with Marketo, Pardot, Google AdWords, MongoDB, Cassandra, Apache, HBase, Twitter and Facebook.
- Relies on partner integrations to connect to QuickBooks, FreshBooks, Freshdesk, Zendesk, Slack, Shopify, Magento and BigCommerce. Other partner integrations include PayPal, Square, Stripe, Jira, Asana and Trello.
Limitations
- Offline mode isn’t available.
- Doesn’t support 3D charts out-of-the-box.
- Doesn’t give optimum performance with Internet Explorer
Suite Support
Top Competitors
Cost of Ownership
| License/Subscription Cost |
|
| Maintenance Cost |
|
| Installation/Implementation Cost |
|
| Customization Cost |
|
| Data Migration Cost/Change Management/Upfront Switching Cost |
|
| Recurring/Renewal Costs |
|
Pricing Details
| Category | Description | Price/Details |
|---|---|---|
| Subscription Cost | What is the cost of the software? | License Cost: |
| Deployment Options | What options are available for product deployment | On-premise Cloud-based/SaaS (AWS/Azure/Other) |
| Pricing Mode | What is the pricing model? | Subscription-based |
| Minimum Commitment | Is there a minimum monthly or yearly commitment required for purchase? | Minimum yearly commitment is required for purchase |
| Custom Quote | Is there an option for requesting a custom quote? | Available |
| Free Trial | Does the solution provide a free product trial option? | Available (for 45 days) |
Compare Business Analytics Tools
Compare Business Analytics Tools
Awards
SelectHub research analysts have evaluated the top Business Intelligence Tools and awarded Dundas BI with best-in-class honors for Advanced Analytics, Data Visualization, Data Querying, Reporting and Mobile BI. Dundas BI stands above the rest by achieving an ‘Excellent’ rating as a User Favorite.


Relevant Articles
Pricing for Business Analytics Tools

Product Publications
10 Advanced Data Visualizations 6 Key Capabilities an Embeddable Analytics Software Should Deliver Dundas BI Product Scorecard Info-Tech’s BI Data Quadrant ReportSimilar Products
Here are the most similar products to Dundas BI.
A note from Dundas Data Visualization
Dundas BI is a business intelligence software solution with data analytics and dashboard capabilities. It works to empower all individuals – from the business user to the developer – to visualize and analyze any data to make real-time, data-driven decisions that produce results. Our versatile BI platform and our unmatched support are just a couple of the reasons why Dundas BI is the #1 Business Intelligence platform, as rated by real users.
With our software, users don’t need to depend on multiple tools as Dundas BI has a variety of built-in functionalities, agile data flows adapted to the user's skills and fully open APIs. Dundas BI is popular for its comprehensive features such as dashboards, data visualization, reporting, mobile, analytics and integration.