Best Business Analytics Software
Buyer's Guide
Fortune Business Insights places the market value of the global big data analytics market at $307.52 billion in 2023, and it’s likely to increase to $745.15 billion by 2030.
We don’t need these numbers to remind us that big data is increasing exponentially. It’s coming at us from all directions and doesn’t all look the same. Using it for business analytics requires competent software tools.
You've come to the right place if you’re in the market for a business analytics solution. This buyer’s guide will help you identify your requirements and goals and give tips and resources to select a best-fit solution.
Executive Summary
- Business analytics involves business oversight, strategy and short and long-term planning.
- The right business analytics system can drive profits and provide critical decision support for planning and innovation.
- Key features of business analytics systems include data management, querying, reporting, dashboarding and data visualization.
- Prescriptive analytics, cloud deployments and acting on insight within dashboards are new business analytics trends.
- Determining your must-have features and planning a selection strategy is an essential first step.
- Prepare a list of questions to ask internally and analytics software companies before making a final decision.
- What Is Business Analytics Software?
- Primary Benefits
- Implementation Goals
- Basic Features & Functionality
- Advanced Features To Consider
- Current & Upcoming Trends
- Software Comparison Strategy
- Cost & Pricing Considerations
- The Best Business Analytics Software
- Questions To Ask Yourself
- Questions To Ask Vendors
- Next Steps
- Product Comparisons
- Additional Resources
What Is Business Analytics Software?
Business analytics software solutions are tools for analyzing organizational information to support performance tracking, decision making and planning.
Business analytics involves finding ways to boost revenue by designing and maintaining winning strategies and optimizing company resources. It includes answers to questions like — Is everything going as planned? Did market trends change?
Finding ways to maintain the company’s course or modify it when necessary is business analytics.
Activities include analyzing employee performance, customer relationships, inventory, expenses, sales, revenue and budgeting data. This practice helps plan how your organization should function.
A common question is — how are BI and business analytics related?
You can consider each one as either the child or parent of the other. Business analytic software isn’t a separate category. Rather many BI tools serve as business analytics platforms.
Read our business intelligence vs. business analytics article for more.
Tabular and graphical reports, dashboards, visualizations and statistical functions are inherent business analytics tools and should feature on your ask list when talking to analytics software companies.
Business analytics also involves forecasting market and buyer trends. Predictive analytics is crucial to data analysis, with businesses seeking greater control over the future.
Business analytics programs can be
- Spreadsheet software
- BI and analytics tools
- Performance management software
- Statistical software
- Project management software
- Accounting software
- Automated Reporting Tools
- Big Data Analytics Tools
- Big Data Visualization Tools
- Business Intelligence Tools
- Client Reporting Software Tools
- Cloud BI Solutions
- Custom Reporting Software Tools
- Data Analytics
- Data Cleaning Tools
- Data Discovery Tools
- Data Integration Tools
- Data Management Tools
- Data Preparation
- Data Warehouse Reporting Tools
- Data Warehouse Tools
- Diagram
- Ecommerce Analytics Software Tools
- Embedded Analytics Tools
- Enterprise Reporting
- ETL Tools
- HR Analytics
- OLAP Tools
- Predictive Analytics
- Qualitative Data Analysis
- Self-Service BI Tools
Primary Benefits
Business analytics can guide your company to achieve its objectives, provided you have access to accurate information, clear goals and a data-driven approach.
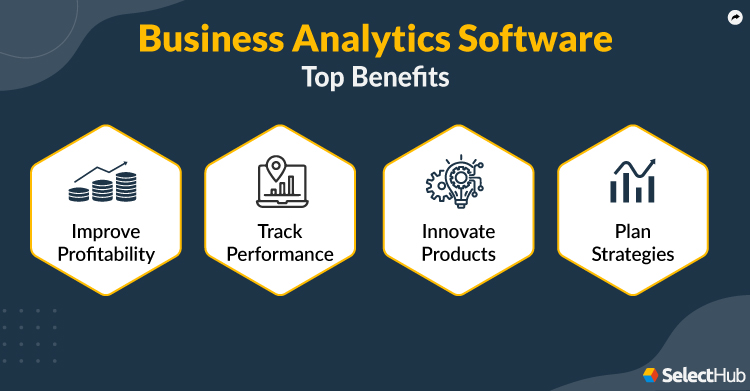
Improve Profitability
Whether you’re a B2B or B2C enterprise, business analytics improves operations, productivity and product quality.
You can optimize inventory levels and avoid stockouts by forecasting demand. Customer churn is less likely when you know how much to order and when. No more “Out of stock” notifications means more satisfied buyers.
Data on customer behavior, market trends and competitor pricing helps you optimize product costs and better position your offerings. You can decide which products to promote and which ones to deprioritize.
Minimize financial loss via risk management — factor in economic conditions, buyer behavior, supply chain disruptions and regulatory changes to make informed decisions.
Track Performance
Key performance indicators (KPIs) are excellent tools to monitor how you’re doing, but things can still go wrong. Downstream processes can stall if the marketing team fails to meet its goals.
Say, you set an introductory discount to kick in after a certain number of leads convert. Based on the revenue projections, you ordered new stock, but it didn’t happen, and now the inventory is backed up.
It’s time for damage control, and business analytics can help you find what went wrong using a root cause analysis. Why did people move away from the sign-up page? Was the webpage glitchy, or did the payment gateway not work?
It’s not just isolated workflows — business analytics extends to monitoring company-wide performance, called enterprise performance management.
It involves keeping track of everyday operations and how they align with the company roadmap.
Directing resources where needed, letting go of loss-making ventures and making changes where necessary — business analytics is behind it all.
Innovate Products
Changing customer preferences keep the market in flux, and even the largest, most agile companies scramble to keep up. You can plan to diversify and discover new product markets with consistent business intelligence and analytics.
And you can do it right from the onset by designing marketing campaigns based on user journey data and segment analysis. Attract new customers by targeting their position in the purchase funnel with a tailored approach that speaks to them.
With KPI monitoring, you can measure the impact of innovation initiatives and make adjustments as you go, informed by accurate and relevant data.
Plan Strategies
Stocking up on products because they sold better this time last year or offering competitive discounts during Super Bowl season — it’s business analytics.
But it isn’t everyone’s forte, requiring statistics and mathematics to analyze data. Functions and calculations are involved, even with the best self-service BI tools.
Drop-down menus, dialogue boxes, and point-and-select and drag-and-drop actions help, but only if you know the ropes.
In the right hands, business analytics gives you a competitive edge with trends forecasting and predictive modeling. Incorporating historical time-series data into regression and what-if analyses helps you plan.
Expert recommendations and analysis of the top BA Software
Implementation Goals
Ask your stakeholders what they hope to achieve with the new software.
It could be different for different people — your C-suite might want to boost profits by getting in more customers, while the business analyst expects to ramp up query performance.
|
Goal 1 Stay Competitive |
|
|---|---|
|
Goal 2 Improve Customer Experience |
|
|
Goal 3 Streamline Operations |
|
|
Goal 4 Deliver Instant Insight |
|
Expert recommendations and analysis of the top Business Analytics Software
Basic Features & Functionality
Let’s get acquainted with the primary business analytics platform capabilities.
| Source Connectivity |
Your business analytics tool should connect to the following:
|
|---|---|
| Dashboarding and Data Visualization |
The solution should allow single-screen, customizable views of your metrics and critical data points. Interactivity using mouse, cursor and tooltips is handy for viewing the desired data. Drill-down and drill-through capabilities help you explore data to the desired level of granularity. Can the platform give you a wider graphics variety by integrating with third-party providers? The dashboards should be embeddable into web pages. Auto-refreshing dashboards give you the latest insight. |
| Data Management |
Your business analytics solution should allow data blending, preparation, exploration and model-building. Advanced data preparation using Python and R libraries helps tackle complex data. Data governance supports information integrity by allowing you to configure and enforce business rules. Metadata Reference indexing and data catalogs keep the data sources discoverable and manageable. Most data is multidimensional, so OLAP analysis is essential. |
| Data Querying |
The platform must be able to run queries on different data structures, schemas and aggregated data. You should be able to write, modify and schedule simple SQL queries or use code-free drag-and-drop tools. The platform should let you run subqueries, filtering, unions, intersections and calculated conditions. In-memory analysis reduces the need to retrieve the same data again, saving time and power. Direct querying of live source connections should be possible. |
| Data Analytics |
R and Python integrations help you perform sophisticated data manipulation and analysis. The solution should have built-in functions and formulae to derive useful information. |
| Reporting |
Not every report is canned, though they have their uses. Ad hoc reporting is in demand, so this functionality is a must, irrespective of the size of your organization. So is interactivity — wouldn’t it be great to do more with reports? And the same goes for exporting reports in standard formats like HTML, Excel, CSV and PDF. Report versioning and scheduling are must-have capabilities. Conditional formatting lets you set conditions so the system highlights the cells that satisfy them. Being able to trigger reports when KPIs achieve specific values might not be a deal-breaker, but consider it if your budget permits. |
| Embedded Analytics |
Embedded analytics software must run in the background, silently feeding values to the host application. It should serve multiple tenants while maintaining total data privacy, so when you log in, it should present data relevant to your role. Embedding isn’t only about presenting data within the host application. It’s also about configuring trigger-based workflows in the host application. The solution must allow updating records in the host application to sync with the analysis results — secure write-backs are essential. Dashboard and report rebranding using logos, fonts and colors should be possible. |
| Security and User Management |
With great power comes great responsibility. And with data access comes the onus to keep it safe. Your solution must allow user management the option to grant role-based access. Administrators should be able to manage authentication protocols, monitor usage and track activity. |
The above list should support your preliminary analytics tools comparison.
Create a business analytics requirements list to determine your needs. Do you seek to add business analytics over a BI tech stack? Call us to receive advice from the experts.
Business analytics solutions are often suites of multiple software, each serving a different purpose. There might be some overlap in functionality, which is fine unless it confuses your users or results in duplicate workflows.
A clear implementation strategy can help here.
Expert recommendations and analysis of the top Business Analytics Software
Advanced Features To Consider
Consider these advanced capabilities if your budget allows it or you plan to expand your business. Knowing about these top-of-the-line capabilities can guide your analytics tools comparison.
| Advanced Connectivity |
The tool should connect to
|
|---|---|
| Advanced Dashboard Features |
The system should support R and Python libraries for creating sophisticated visualizations. Animations enhance presentations by showing changes across groups or periods in time. |
| Predictive Analytics |
Analytics applications that use Predictive Model Markup Language (PMML) describe predictive models similarly, making their import/export easier. Not having this capability means relying on your proprietary software to define the format or using AutoML to move predictive models between applications. Text mining, time series and what-if analysis are useful predictive analytics techniques. Clustering, regression, segmentation, cohort and sentiment analysis are others. Statistical functions are essential for handling the various calculations, though these may vary by software. |
| Augmented Analytics |
Automation is a significant benefit of artificial intelligence (AI), accelerating analytics and freeing you from repetitive tasks. Thanks to automation, dataset matching, joining, tagging and annotation happen before data preparation. You can set up automation to generate forecasts, find segments in datasets, issue outlier alerts and display relevant insights before you start exploring. |
Expert recommendations and analysis of the top Business Analytics Software
Current & Upcoming Trends
Buying software is a long-term commitment, and learning about industry trends helps you plan better today. Acquiring advanced capabilities at today’s price might save you from spending more for those features later.
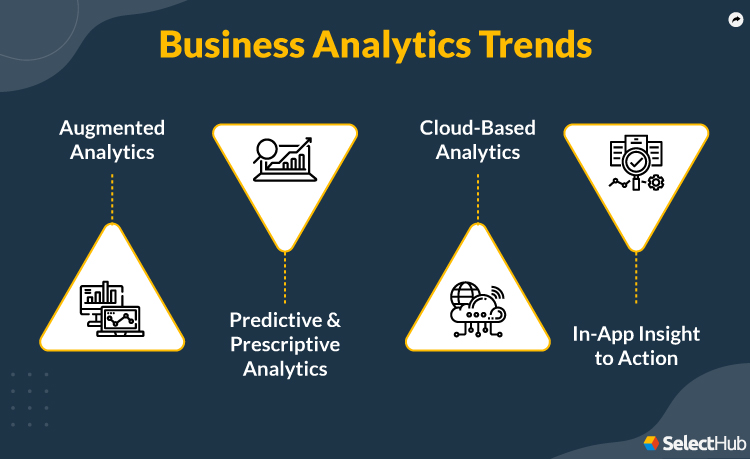
Augmented Analytics Takes Center Stage
Automation and artificial intelligence (AI) have done wonders for data pipelines, speeding up processes like never before. Data processing is faster with AI systems able to understand and answer in natural language.
Some software vendors offer voice-based querying, including the software suggesting possible next steps. Predictive suggestions and search recommendations are life savers when hustling for information.
Having the software suggest datasets to analyze and possible visualizations for the selected data points is instant, quick and intuitive.
Augmented analytics platforms are evolving and hold tremendous potential to enhance business analytics.
Predictive and Prescriptive Analytics Will Lead The Way
Predictive modeling is popular — almost every vendor worth their money advertises it as a unique selling point of their software. As one tasked with procuring a business analytics tool, you’ll likely read about it in every vendor proposal. Well, it’s as good as it sounds.
Predictive analytics can illuminate the way by interpreting your existing data to forecast your business health, upcoming opportunities and market trends.
Beyond predictions lies action — prescriptive analytics. Using business intelligence, data mining, analytics and AI, your software can offer options for proceeding with the information.
The decisions lie with your top management, of course, but having your options in black and white saves time. It helps business analytics companies become proactive instead of reacting to changes.
Cloud-Based Analytics
With an easy-deployment, no-maintenance model, cloud-based business analytics software are available with the click of a few buttons.
SaaS (Software-as-a-Service) platforms and private/public cloud services are fast, lightweight and scalable.
Many enterprises are embracing the cloud, using a common user directory or identity provider, federated protocols like Security Assertion Markup Language (SAML) or custom integrations to sign in.
It lets you work with your host application and the business analytics platform, whether they’re in the cloud or on-premise.
The ease of cloud data access does away with the need to install expensive infrastructure on-premise.
Cloud deployment is an evolving trend, with business analytics companies offering BI solutions for financial services, pharmaceuticals, manufacturing and healthcare.
And innovations like the universal semantic layer will continue to attract enterprises to the cloud.
Take Action Within Dashboards
Till recently, dashboards and visualizations were evolved cousins of tabular reports, giving you the required insight at a glance.
Now they can be more.
Say purchases are down, and you need to pause orders — to do this, you need to navigate to the supplier portal in your procurement application.
What if you could do the same from within the dashboard itself?
Some software vendors are trying to close this gap between information and action — Tibco Spotfire being one with its Cloud Actions module.
It integrates with TIBCO Cloud Live Apps and TIBCO Cloud Integration to let you trigger transactions directly from data visualizations and update records in the application.
This trend seems likely to catch on — it lets you take proactive action with almost no context-switching and database connectivity for record syncing.
Read more in our Business Analytics Trends article.
Expert recommendations and analysis of the top Business Analytics Software
Software Comparison Strategy
A business analytics solution is a combination of two or more software solutions ranging from BI, statistical and spreadsheet platforms to documentation tools.
It’s why integration is a prime consideration. But a solution that integrates well might not be great at presentation, so you need a reporting tool. How can you make sense of all the combinations and still cover all your requirements?
Our Jumpstart Platform makes comparing software easy with scorecards that lay it out in black and white for you. A four-tier scoring system evaluates features, requirements and modules, giving an overall score to each product.
Conduct in-depth research about the vendor by reading customer reviews and case studies.
Cost & Pricing Considerations
The average cost of business intelligence software is $3000 per year, ranging from $600 to $6000. Small to mid-sized businesses are likely to spend $10,000 to $100,000 annually on data analytics, with a minimum of $70 per user per month.
To factor in hidden costs, calculate the short and long-term overheads before deciding.
- Determine if the software’s pricing structure aligns with your budget. Does it meet your functional requirements, user capacity and data processing needs?
- Consider the total cost of ownership beyond the initial license fee. What will implementation, customization, training, upkeep, upgrades and support cost you? How much will scaling the software cost?
- Calculate the expected return on investment (ROI) with a cost-benefit analysis. Do the benefits balance out the cost?
Get our free pricing guide to determine which business analytics companies are in your price range.
See prices for the top BA Software... Plus get important questions to ask.
The Best Business Analytics Software
Our analysts curated some of the top business analytics solutions on the market. Check out our picks below!

Power BI
What It Does
Microsoft Power BI is an analytics solution supporting business analytics with reporting, visualization and dashboarding. Automated workflows enable report generation by extracting, transforming and loading data into a vendor-managed database.
The solution integrates with other Microsoft platforms, including Microsoft 365 and Outlook. You can embed interactive reports within PowerPoint presentations.

Ask a question in the Q&A box or tap an icon to open the underlying report. Source
Product Overview
| User Sentiment Score | 88% |
| Analyst Rating | 90 |
| Company Size | S | M | L |
| Free Trial Info | Free Power BI Pro and Premium Per User (PPU) trials are available. The Desktop version is perpetually free. |
What It’s Best For
| Capability | SelectHub Analyst Score |
|---|---|
| Data Management | 100 |
| Embedded Analytics | 100 |
| Dashboarding and Data Visualization | 94 |
| Data Querying | 90 |
| Reporting | 89 |
Pros and Cons From User Reviews
| Pros | Cons |
|---|---|
| Its seamless integration with Microsoft systems was a significant benefit, said about 96% of users. | About 85% of users mentioned its steep learning curve as a blocker to adoption. |
| About 86% of users said the tool had an excellent ERP system and warehouse connectivity. | Around 56% of users said it was value for money, but 44% found it expensive. |
| Around 98% of users commended its intuitive visualization builder, ready-to-go templates and formatting options. | Over 96% of users said it was resource-heavy and deployment took too long. |
Oracle Analytics Cloud
What It Does
It’s a cloud-based reporting and analytics platform offering data prep and visualization. Augmented analytics allows anyone with basic software skills to run queries for business analysis.
Machine learning (ML) drives data modeling and auto-charting for visualization. Collaboration is available with role-based access permissions by the dashboard.

Building a data model in Oracle Analytics with conditional formatting. Source
Product Overview
| User Sentiment Score | 84% |
| Analyst Rating | 87 |
| Company Size | S | M | L |
What It’s Best For
| Capability | SelectHub Analyst Score |
|---|---|
| Dashboarding and Data Visualization | 97 |
| Data Management | 95 |
| Reporting | 93 |
| Advanced Analytics | 89 |
| Data Querying | 88 |
Pros and Cons From User Reviews
| Pros | Cons |
|---|---|
| All users citing interactivity praised the platform's drill-down and filter features. | About 88% of users complained support was unreliable and slow to respond. |
| About 95% of users said the platform had robust reporting features. | Around 74% of users reviewing pricing said the solution was expensive. |
| About 83% of users found it user-friendly. | Approximately 20% of users mentioned occasional performance lag. |
MicroStrategy
What It Does
MicroStrategy is an analytics platform that deploys flexibly in the cloud using containers. The solution supports data integration and ETL, connecting to over 200 sources and platforms.
Features include interactive dashboards, natural language processing (NLP) and self-service visualization building. The solution has predictive modeling, statistical and data mining capabilities.

User permissions are configurable at the administrator level in MicroStrategy. Source
Product Overview
| User Sentiment Score | 82% |
| Analyst Rating | 86 |
| Company Size | M | L |
What It’s Best For
| Capability | SelectHub Analyst Score |
|---|---|
| Dashboarding and Data Visualization | 100 |
| Data Management | 100 |
| Advanced Analytics | 98 |
| Reporting | 89 |
| Embedded Analytics | 82 |
Pros and Cons From User Reviews
| Pros | Cons |
|---|---|
| All users reviewing reporting said the platform was robust and efficient. | All of the users reviewing pricing rated it as expensive. |
| All users commended its mobile analytics capabilities. | Over 91% of users said implementation was tedious and time-consuming. |
| More than 87% of users found it intuitive. | Around 81% of users said the solution had a steep learning curve. |
Spotfire
What It Does
TIBCO Spotfire is an AI-driven business intelligence and data discovery platform. Streaming data integration enables near-real-time insight via intuitive dashboards and visualizations.
You can learn about the product through free e-learning courses on the vendor’s website. A proactive user community makes Wiki entries and free dashboards publicly available.

Answer business questions with custom data views. Source
Product Overview
| User Sentiment Score | 84% |
| Analyst Rating | 83 |
| Company Size | S | M | L |
| Free Trial Info | The vendor offers a 30-day free trial. |
| Starting Price | $0.99 |
What It’s Best For
| Capability | SelectHub Analyst Score |
|---|---|
| Data Management | 99 |
| Dashboarding and Data Visualization | 91 |
| Advanced Analytics | 88 |
| Reporting | 84 |
| Data Querying | 79 |
Pros and Cons From User Reviews
| Pros | Cons |
|---|---|
| Over 91% of users appreciated the report generation solution. | All users citing analytics said the tool analyzes small datasets better. |
| Mentioning dashboards, 86% of users said they were happy with the customizations. | All users reviewing resources said more help documentation was needed. |
| Around 78% of users praised its interactive visualizations. | About 75% of users said performance while handling large datasets could be better. |
Qlik Sense
What It Does
It’s self-service analytics software with an AI module that offers context-aware suggestions and recommendations. The Qlik Insight Bot suggests search terms, results and visualizations based on browsing history.
The system encrypts data at rest, with row and column-level permissions.

A performance dashboard shows the sales figures by store with a YoY comparison.
Product Overview
| User Sentiment Score | 85% |
| Analyst Rating | 85 |
| Company Size | S | M | L |
| Free Trial Info | The vendor offers a 30-day free trial. |
| Starting Price | $30 |
What It’s Best For
| Capability | SelectHub Analyst Score |
|---|---|
| Data Management | 100 |
| Dashboarding and Data Visualization | 100 |
| Advanced Analytics | 95 |
| Data Querying | 92 |
| Reporting | 88 |
Pros and Cons From User Reviews
| Pros | Cons |
|---|---|
| Around 86% of users said the solution was easy to use. | About 90% of users said implementing security was tricky. |
| Nearly 85% of users said it had a short learning curve. | Around 86% of users complained about limited customization. |
| About 81% of users appreciated its embedded analytics capabilities. | About 86% of users who mentioned pricing said it was costly. |
| Around 77% of users were impressed with the interactivity and responsiveness of its visualizations. | Nearly 78% of users said the platform’s sharing and collaboration capabilities left much to be desired. |
Expert recommendations and analysis of the top Business Analytics Software
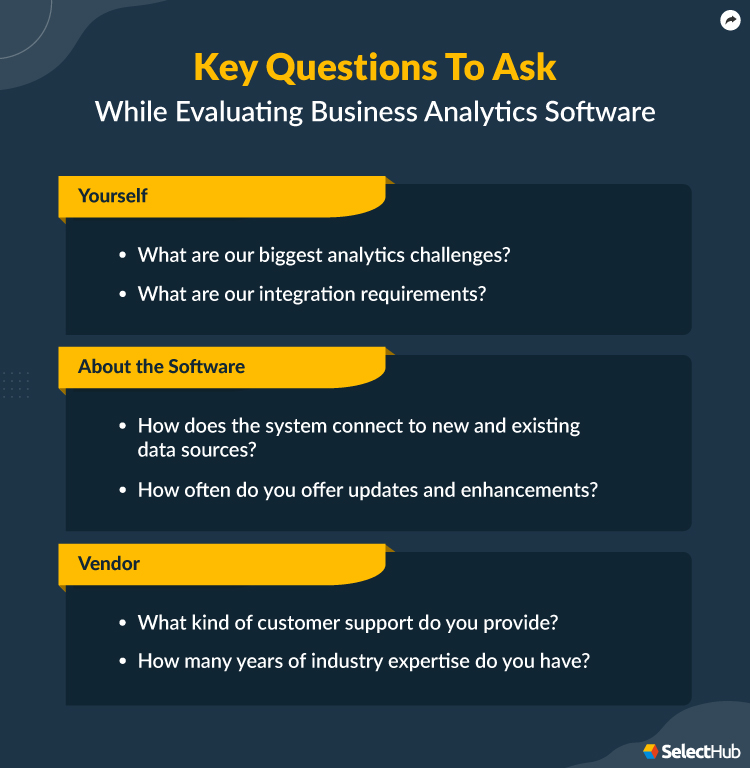
Questions To Ask Yourself
Finalizing requirements may involve a few discussion rounds with everyone involved. Ask the right questions within your organization to understand stakeholder expectations.
- What are your biggest analytics challenges?
- What are our integration requirements?
- What level of customization will we need?
- How many employees will use the software? Will they need training?
- Do we have the technical resources, or must we rely on the vendor?
Questions To Ask Vendors
Asking the right questions can save you time and much heartburn later. Additionally, it gives vendors a clear picture of your expectations.
About the Software
- What's the workflow for creating and populating a new dashboard with metrics and KPIs?
- How does the system connect to new and existing data sources?
- How often do you offer updates and enhancements?
- How can your software’s capabilities benefit companies in my industry?
- What are its core strengths?
About the Vendors
- What kind of customer support do you provide?
- How many years of expertise do you have in the industry?
- What company sizes do you typically work with?
- How does your technical support team handle help requests?
- How long does onboarding usually take?
Expert recommendations and analysis of the top Business Analytics Software
Next Steps
The best business analytics solutions integrate with your tech stack, improving the way you do business. They drive revenue-boosting processes, reduce turnarounds and speed up development and delivery cycles.
Whether you’re a CFO, manager or procurement executive tasked with selecting a business analytics solution, this buyer’s guide gives you the tools and resources to succeed.
Reach out to analytics software companies with questions and a request for proposal (RFP).
Get our free analytics tools comparison scorecard with a module-based rating of the leading business analytics platforms. Learn what each module offers with a detailed description of each underlying feature rated from zero to 100.
Shortlist vendors after reviewing their responses and reach out to them for final discussions, starting at the top of the list.
Good luck!
Product Comparisons
- Power BI vs. Oracle Analytics Cloud
- Power BI vs. MicroStrategy
- Power BI vs. Spotfire
- Power BI vs. Qlik Sense
- Power BI vs. Tableau vs. Qlik Sense
- MicroStrategy vs. Oracle Analytics Cloud
- Spotfire vs. Oracle Analytics Cloud
- Qlik Sense vs. Oracle Analytics Cloud
- MicroStrategy vs. Spotfire
- MicroStrategy vs. Qlik Sense
Additional Resources
Top 10 Business Analytics Tools Leaders by Analyst Rating (of 109 products)
(of 109 products) GET THE IN-DEPTH REPORTProducts found for Business Analytics Tools (Page 2)


Pricing & Cost Guide
Narrow Down Your Solution Options Easily
closeApplying filters...
Search by what Product or Type or Software are you looking for