Not all business intelligence tools are created equal. Sure, there are plenty of BI systems with great reporting, data analytics and visual functions. But just because a BI tool works great for one business doesn’t guarantee it’ll have the same impact for another. This fact is especially true when you consider the size of a business. For large-scale businesses, enterprise business intelligence tools suffice.
This Guide Covers:
What Is Enterprise Business Intelligence (BI)?
Enterprise BI is software designed for use in large businesses. The goal is to increase productivity and efficiency in the complex environment of an enterprise.
So enterprise BI, then, is simply a BI software that caters its functionality to large businesses. But is that all it means? Of course not.
Let’s understand enterprise solutions better by comparing them with self-service tools.
System Deployment and Management
Enterprise business intelligence software, due to its size and complexity, requires a lot more management than self-service BI tools. Department-level management is the norm for self-service BI.
However, enterprise BI solutions are usually managed centrally by an IT department. This setup is especially common for enterprise BI tools deployed on-premise. Running an enterprise-level on-premise system requires a high-level budget, an existing framework and a fully staffed IT department.
Many organizations deploy enterprise business intelligence software on-premise exclusively to prevent malicious access. But as the cloud became popular and secure, the number of vendors offering a cloud computing BI platform grew manifold.
Today, most self-service BI tools are deployed on the cloud. But when it comes to enterprise business intelligence, businesses have a plethora of deployment options. That said, most BI buyers today don’t have a strong preference for either deployment, as long as their BI tool comes with the features they need.
Data Sources
The data that flows through enterprise BI tools differs from its self-service counterparts. Enterprise business intelligence software processes huge amounts of data. As you can imagine, a large business tends to collect a lot more data than smaller ones. This need requires a system with a higher capacity for data analytics than average self-service BI tools.
Enterprise BI tools utilize different data sources. A small business can get away with using CSV files to collect a few hundred data points. All you have to do is upload it to a self-service system, and it can produce insightful analytics. Unfortunately, a CSV isn’t sufficient to hold the data points large businesses need an enterprise BI solution to analyze.
In light of this, enterprise business intelligence solutions analyze data taken from rigid, well-structured data models. Usually housed in data warehouses like a SQL server, these data models are complex but secure – and built specifically for use in data analytics.
Data Management
Self-service BI tools don’t need data management More often than not, all that’s done to manage this data is saving and uploading a CSV file. However, managing data for enterprise business intelligence software is a sizeable undertaking. IT departments generally have a huge hand in enterprise BI data management.
Because of this, self-service tools have shorter lead times, leading to quicker business decisions. But, the data isn’t governed.
Enterprise business intelligence software, along with your IT department, provides thorough data governance. The platforms themselves maintain a high level of security and can help test your data for accuracy. This eliminates any duplicate data sets and other forms of bad data. Self-service tools can be better for on-the-fly decision-making. For long-term, accurate planning, enterprise BI tools are better.
Get our BI Tools Requirements Template
Enterprise BI Capabilities
Collaboration
Larger organizations need a corporate BI solution that facilitates seamless collaboration between departments and users. The platform should empower you to securely publish, distribute and share insights with external clients without losing data in transit.

Analytics
Ask and answer questions on the fly with the help of enterprise business intelligence software. Derive insights with advanced analytics and statistics capabilities. You get a strategic data view and can also dig into granular data.
Infrastructure
A robust enterprise BI tools offers self-service capabilities without IT assistance. It provides customizable dashboards, revision history, search functions and tools to organize resources to find data when you need it.
Governance
A centralized data source helps maximize reusability, consistency and reliability to ensure robust reporting while providing accurate analysis. It keeps the proprietary data secure while restricting access to unauthorized users.
Visualization
An easy-to-use visual interface helps you create basic and advanced visualizations such as pie charts, bar charts, heat maps and scatter plots.
Seamless Integration
Ensure seamless integration with existing data structures to flexibly connect to on-premise or cloud-based data sources. Access data from any device, laptop, desktop or tablet.
Best Enterprise Business Intelligence (BI) Software
Only a select few business intelligence tools classify as enterprise BI solutions. Let’s look at the best solutions to gain powerful decision-making insights.
Power BI
Power BI is a business intelligence tool that allows you to unify multiple data sources to create interactive dashboards and reports. It draws useful insights from visualizations for making robust decisions.

Sales Dashboard in Power BI depicting the sales across countries, brands and manufacturers.
Benefits
- Leverage a 360-degree Data View: Obtain a live 360-degree view of data to gain crucial business insights with real-time dashboards.
- Visualize Data Trends: Present data in graphs, charts, maps or other graphical representations to visualize and interpret trends.
- Facilitate Collaboration: Share reports and dashboards with other team members and collaborate on important business decisions while reducing inefficient meetings.
- Access On-the-Go: Access visual analytic to stay connected with the team and share insights from any device with mobile-optimized reports and apps.
- Ensure Ease-of-Use: Encourage users to adopt a data-driven culture with self-service BI capabilities.
Features
- Interactive Data Visualizations: Create interactive data visualizations with drill-down, tooltips, highlighting and filtering capabilities. Leverage tooltips to provide contextual information about visualized data points. Use a highlighting function to highlight data subsets.
- Data Preparation: Ingest, transform, integrate and enrich data for analysis. Organize unstructured data into interpretable datasets to gauge trends and patterns. Leverage intuitive filtering and data profiling capabilities to prepare data.
- Data Source Connectivity: Pull data from multiple on-premises or cloud-based data sources, including Salesforce, Dynamics 365, Excel, Google Analytics, text/CSV files and more.
- Data Governance: Secure data with role-specific data protection and row-level security measures. Centralize data governance, security and management across the organization to protect data from malicious access.
- Natural Language Processing: Explore data through conversational language and find useful answers to data-related questions.
Limitations
- Limited graphical visualizations.
- Difficult to work with huge datasets.
- Doesn’t support SQL queries.
- Lacks an intuitive interface.
Platform:
Company Size Suitability: S M L
Domo
Domo is a cloud-based business management application that provides in-depth insights into business metrics to boost performance. It offers a unified view of business data by consolidating multiple data sources.
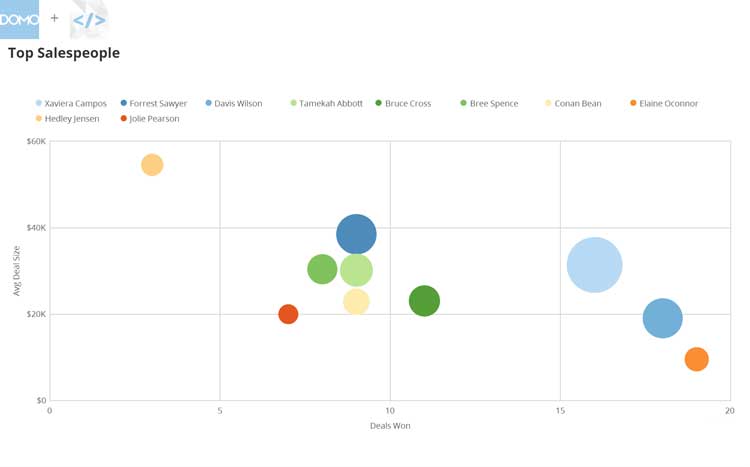
Bubble chart in Domo displaying the top salespeople across the organization.
Benefits
- Answer Business Questions: Access data in real time through natural query-based searches. Ask specific questions, drill down into the data, drill up to get a complete view and create visualizations from a single interface.
- Facilitate Collaboration: Share data and insights through various channels to facilitate company-wide communication and engagement with data at all levels.
- Customize Dashboards and Alerts: Schedule alerts that send out emails based on the set criteria. Set dashboards to auto-update and incorporate new data.
- Create a Unified View: Consolidate multiple data sources to create a unified view of business data. Centralize data from different on-premise and cloud sources through connectors, joining, sequencing and visual drag-and-drop ETL processes.
- Save Time: Automate manual work to eliminate time spent accessing and combining complex data across disparate systems.
Features
- Dashboards: Consolidate different datasets into a centralized view. Build interactive cards and store them in collections or pages.
- Data Exploration: Explore data to uncover patterns, trends, characteristics and points of interest using filter, drill and link capabilities.
- Mobile Access: Harness the power of business intelligence dashboards, drill-down and filtering functions through native mobile apps. Stay connected with team members anytime and anywhere.
- Embedded Analytics: Integrate data management, visualizations, machine learning and full-service analytics in one place.
Limitations
- Limited ad hoc reporting capabilities.
- Limited geographic and geospatial analytics.
- Lacks robust learning resources.
- Lacks user-friendly dashboards and reports.
Platform:
Company Size Suitability: S M L
Sisense
Sisense is an end-to-end data analytics platform that consolidates data from cloud and on-premise sources for analysis. It optimizes data preparation, uncovers useful insights and promotes collaboration across the organization.
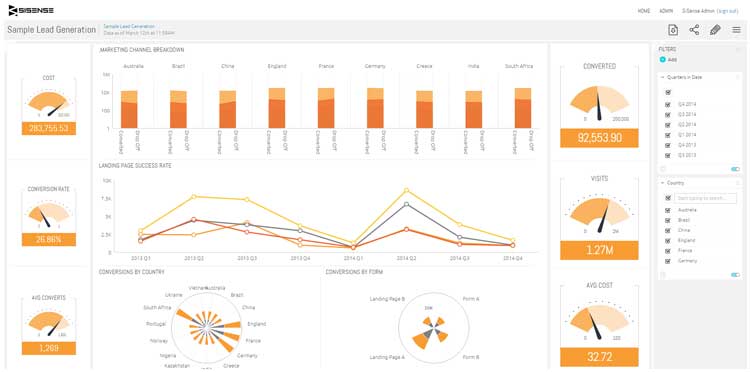
Lead generation dashboard in Sisense showing conversions across different countries.
Benefits
- Unearth Actionable Insights: Combine data from diverse sources to build powerful visualizations and transform raw data into actionable insights. Identify trends and analyze patterns to make predictions, improve business practices, reduce errors, boost ROI and streamline business performance.
- Ensure Data Security: Detect data anomalies and send alerts instantly with advanced machine learning capabilities. Set role-based access restrictions and maintain data security protocols to safeguard data from malicious access. Incorporate built-in recovery and audit strategies to prevent data loss.
- Conduct Quick Analysis: Perform thousands of queries on large datasets and return results faster to make quick and efficient decisions.
- Promote Collaboration: Collaborate with other users to share reports, dashboards, insights, KPIs, goals and objectives while ensuring data security.
- Bring Data Intelligence to Users: Connect, blend and analyze data in an intuitive visual framework with self-service BI capabilities.
Features
- Calculated Columns or Fields: Implement business logic by applying various formulas and functions to the existing data for creating new fields.
- Data Blending: Blend data from multiple sources in a centralized location to get a holistic view. Explore further via slicing, dicing, drilling and filtering with a straightforward interface.
- Data Visualizations: Create intuitive data visualizations such as bar charts, pie charts, scattergrams, histograms, line graphs, maps and more. Access a library of pre-built graphics and widgets to manipulate them.
- Augmented Intelligence: Receive alerts and notifications when anomalies or variations are detected in the data. Automate manual tasks and data-driven workflows to save time.
- Real-time Insights: Maintain live data connections and monitor dashboards in real time. Configure push notification alerts to receive automatic updates when changes occur.
Limitations
- Lacks predictive modeling and analysis capabilities.
- Lacks an intuitive mobile user interface.
- Doesn’t support advanced visualizations such as 3D graphics.
- Doesn’t work well with complex datasets.
Platform:
Company Size Suitability: S M L
Qlik Sense
Qlik Sense is a data analytics platform that enables data-driven decisions by leveraging artificial intelligence. It allows you to create and explore intuitive visualizations with drag-and-drop capabilities.

Dashboard in Qlik Sense depicting sales and gross profits across various chains.
Benefits
- Get a Competitive Advantage: Obtain insights into internal operations, processes and profits while monitoring market trends. Set benchmarks to track performance metrics, direct resources and capitalize on profits based on changes in empirical data.
- Find Answers Independently: Get data insights with an intuitive, self-service interface. Share insights directly, both internally and externally.
- Ensure Flexible Deployment: Deploy the solution on-premise, on the cloud or on multiple clouds with the flexibility to modify the infrastructure as business needs changes.
- Boost Scalability: Scale as the business grows while maintaining consistent performance, faster response times, reliability and security.
- Leverage Automated Recommendations: Leverage machine learning capabilities to obtain automated visualization recommendations based on the selected data.
Features
- Data Visualization: Create intuitive visualizations facilitating search, drill-down, zoom out and filter actions. Transform complex data into digestible charts and dashboards. Present data as bar, area and grid charts, heatmaps, multi-KPI and word cloud charts.
- Self-service Data Preparation: Combine, transform and ingest data from multiple sources with AI-powered recommendations. Bring out complex data relationships through associative indexing techniques. Clean, organize and enrich data to make it fit for analysis.
- Data Mining: Identify hidden patterns in huge data sets and detect outliers through exploration, statistical analysis and ML-based algorithms.
- Data Connectivity: Combine data from multiple sources, including databases, files, spreadsheets, websites, cloud-based and on-premise applications and custom sources.
- Embedded Analytics: Add custom visualizations, data sources and reports into portals, applications, intranet and extranet sites via API integration to facilitate analysis, drive processes and foster innovation.
Limitations
- Lacks robust reporting capabilities.
- Lacks dashboard and report templates.
- Doesn’t support a multi-developer environment.
- Limited export options.
Platform:
Company Size Suitability: S M L
Infor Birst
Infor Birst is a cloud-based analytics solution that allows you to identify trends in business data, predict future outcomes and make informed decisions. Leverage machine learning capabilities to build visualizations, gather customer insights and recognize data patterns.

Healthcare dashboard in Infor Birst displaying different profits against different service lines.
Benefits
- Deliver Results Faster: Deliver faster analysis through automated data analysis technology, cloud architecture and reusable metadata.
- Ensure Data Clarity: Promote data clarity while reducing ambiguity by offering unique views into data to all users irrespective of technical expertise.
- Leverage Self-service Tools: Explore, analyze and visualize data with self-service tools to give employees a bird’s eye view of the information at different technical levels.
- Make Data-driven Decisions: Collect, organize, explore and visualize data to identify trends, patterns and outliers. Gauge business operations to make data-driven decisions.
- Predict Future Outcomes: Analyze historical data to predict future trends and outcomes by leveraging AI capabilities.
Features
- Text Mining: Explore and analyze huge amounts of unstructured text data to identify concepts, keywords, topics, patterns and other attributes.
- Dashboards: Create dashboards with intuitive charts like bar, column, line, pie, area, stacked, meter, bubble, tree and heat maps. Explore data with drag-and-drop, double-click, auto-complete search, guided visualization and visual filtering capabilities.
- Multi-tenant Cloud Architecture: Scale vertically and horizontally with multi-tenant cloud architecture built on a multi-node environment. Speed up insight generation by reducing time spent on repetitive tasks.
- Machine Learning: Build visualizations based on predictive analytics and recognize patterns in data via Smart Analytics.
- Automated Data Refinement: Merge data from multiple sources into a centralized database and optimize it for analysis.
Limitations
- Lacks advanced analysis.
- Doesn’t support a mapping feature for location analysis.
- Lacks synchronization between the front and back end.
- Limited reporting capabilities.
Platform:
Company Size Suitability: S M L
Conclusion
It is vital to select the enterprise business intelligence tool with the right set of functionalities to make the best use of data and other resources. With BI constantly evolving, it makes sense to consider innovation as a priority in your processes. Did we capture your favorite enterprise BI software? If not, which is your favorite, and why?
Analyst-Picked Related Content
Pricing Guide: Discover the true cost of Business Intelligence Tools
Comparison Report: An Interactive analyst report with comparison ratings, reviews and pricing

5 comments
Join the conversationRoksana - July 22, 2019
Thank you for the article. Enterprise Business Intelligence Tools are really cool. We use enterprise development when to transform business. It helps us modernize core legacy systems, switch to more innovative enterprise software minimizing the friction of such a bimodal IT strategy.
Bergen Adair - July 24, 2019
Thanks for reading Roksana! It’s excellent to hear how BI impacts businesses in the real world. Thanks for commenting and sharing your perspective with other readers.
Saad Hussain - January 31, 2019
Where is MS POWER BI? It’s also a big player in BI field.
Kim O'Shaughnessy - January 31, 2019
Hi Saad,
Thanks for your comment. We recognize Microsoft Power BI’s presence in the market, as it ranks as one of our top products on our BI Leaderboard. You can read more about this product on our website here.
Nik Pavlov - January 12, 2020
Microsoft PBI is considered as a self-service BI not really a traditional, enterprise one.