The vendor is phasing out your data mining platform. You want to stick around by upgrading to the new version, but it won’t have your preferred features. It’s time to move on to another BI tool but which one?
This article showcases the top data mining tools to help you select the right system.

Article Roadmap
Data mining is the process of finding patterns in data by building and training models, while business intelligence involves extracting helpful information from them.
Data mining software solutions are programs that assist in identifying these patterns.
Best Data Mining Tools
The best data mining software solutions free your teams with self-service BI capabilities, interactivity and visual analytics. What else should matter when making a purchasing decision?
Our analyst team identified the top five data mining tools to help you narrow your requirements checklist.

RapidMiner Studio
RapidMiner Studio is a desktop-based visual designer for data science workflows. Its free edition serves academic researchers and has a limit of 10,000 data rows and one logical processor.
The platform is open-source with a free trial version that’s upgradable to a commercial license. The vendor decommissioned RapidMiner Cloud in 2019, replacing it with a web service. There’s the option to use AWS or Azure cloud to run the RapidMiner Server, a PostgreSQL database and a Docker deployment manager. Find more information here.
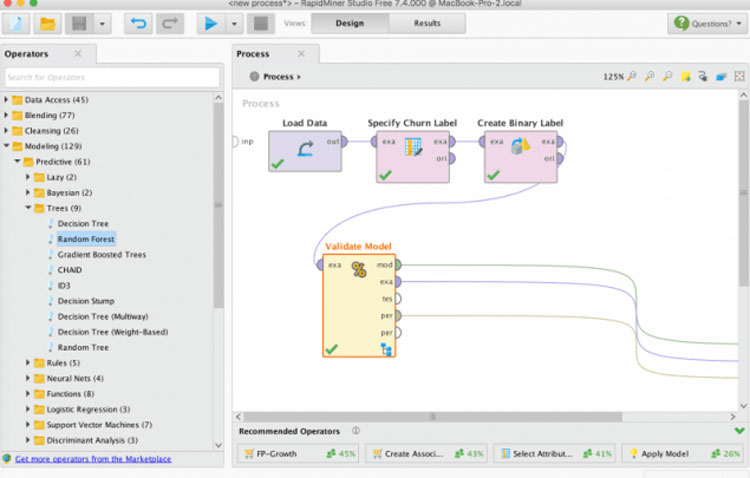
Visual workflow designer in RapidMiner Studio.
Top Benefits
- Deliver Faster: Reduce the time to insight — get answers faster with visual analytics and ML-driven models.
- Gain Comprehensive Insight: Derive meaningful results by analyzing various data types from Microsoft Excel, Access, file formats, SQL and NoSQL databases, webpages and the cloud.
- Anticipate Trends: Machine learning algorithms help build predictions using data models.
- Extend Its Functionality: Do more with pre-stored plugins from the RapidMiner Marketplace and community-contributed algorithms.
Primary Features
- Parallel Processing: Speed up data mining with the Parallel Processing Extension, the Subprocess operator and the parallel execution framework.
- In-Database Processing: Accelerate analytics by reducing data movement — run data prep and ETL inside databases.
- Data Preprocessing: Get data ready for model-building or visualization — do the groundwork using its interactive prep tool, Turbo Prep.
- GUI for Analytics: Cleanse and transform datasets for model-building using a visual drag-and-drop interface.
- Python-R Integration: Run Python or R code within the application, or call RapidMiner Studio from Python using an open-source library.
Limitations
Platform:
Company Size Suitability: S M L
Alteryx Designer
Alteryx Designer is a self-service data mining tool with over 300 low-code/no-code tools for automating analytics workflows. It’s part of the Alteryx business intelligence and big data analytics suite.
The module connects to many data sources and provides a handy dashboard to monitor data usage and distribution across workflows.
Identifying patterns and useful trends is as simple as clicking on the Run button on the interface, which includes machine learning and text mining tabs.
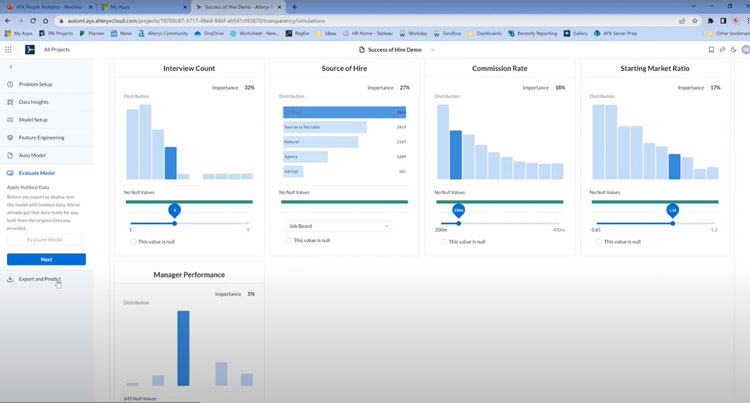
An ML-driven success assessment of a hiring project in Alteryx. Source
Top Benefits
- Stay Competitive: Gain fast insights with no-code data prep — cleanse incoming information with easy user actions.
- Leave No Data Behind: Source data from Adobe Analytics, Amazon Athena, Aurora, Redshift and the Alteryx database. Retrieve data from PDFs, images, text documents and multiple spreadsheet tabs.
- Generate Reports: Generate and share reports with other BI platforms, including Tableau, Power BI and Qlik Sense.
- Derive Location Insights: Incorporate information about lucrative markets, operationally risky areas, remote staff allocation, drive times and routes.
Primary Features
- Alteryx Designer Cloud: Orchestrate no-code cloud data pipelines with intuitive screen prompts, over 30 data prep tools and drag-and-drop user actions. Profile data and address quality issues without leaving the interface.
- Efficient Data Processing: The platform loads and starts processing smaller datasets rather than waiting for the entire lot to upload to RAM, then creates a temp storage file in memory.
- Data Preparation and Blending: Blend and prepare data without writing SQL code or custom scripts. Use data cleaning tools to automate manual tasks like eliminating duplicate entries, summarizing data and removing null values.
- Generative AI: Document workflows using AI-generated summaries with OpenAI’s GPT AI in the background. Generate client-ready insights using the Microsoft Azure Cognitive Services Open AI module.
- Extensibility: Build custom tools and plugins using vendor-provided and community-contributed software development kits (SDKs).
Limitations
- The platform is resource-intensive.
- There’s a steep learning curve.
Platform:
Company Size Suitability: S M L
Sisense For Cloud Data Teams
Now Fusion Analytics, Sisense for Cloud Data Teams is AI-driven advanced analytics and data mining software. Functionalities include reporting and data visualization with robust APIs for extensibility.
The vendor offers three pricing tiers, with the Standard and Professional plans being capacity-based. The Enterprise version is a tailored package with unlimited capacity and priority support.
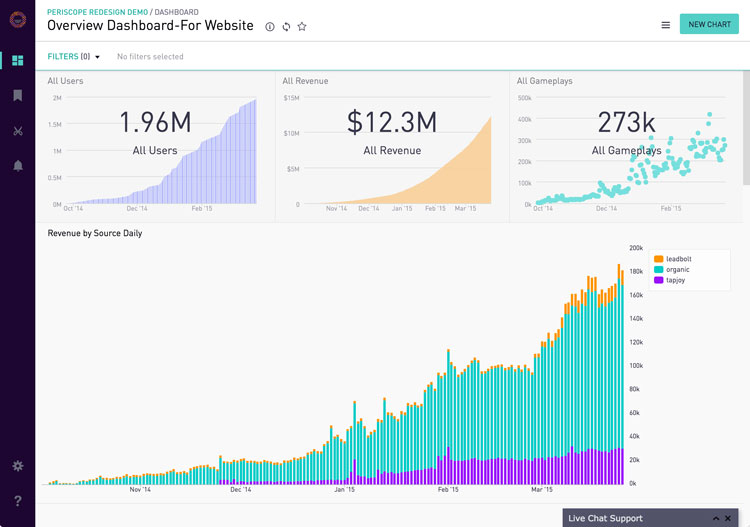
A dashboard shows the daily website revenue by source.
Top Benefits
- Reduce Costs: Save time, money and resources by building data pipelines in the cloud with support for Google Cloud Platform, Snowflake and AWS.
- Forecast Trends: Explore data on the fly by building models as you go. Make predictions with data manipulation and discovery using Python/R integrations.
- Harness Data Science: Get the benefits of automation and natural language processing (NLP). Build ML algorithms for supervised and unsupervised learning from sophisticated datasets.
- Gain Quick Insights: Optimize query performance with real-time data modeling using the Sisense data engine.
- Democratize Data: Empower your staff with data mining and analytics skills — empower them to search for insights using a simple query language. Understand data at a glance by summarizing statistics and adding them to SQL tables.
Primary Features:
- Python/R Integrations: Generate predictions and create custom charts using statistical analysis. Pull SQL query results into Python while working within the chart editor.
- Data Blending and Prep: Ingest, prepare, transform, visualize and enrich data from cloud warehouses into your repositories using AI (artificial intelligence) and Git workflows.
- NLP: Provide timely decision support with accurate information — analyze data in-depth without coding. Sisense Sense-IQ allows plain language queries.
- Fast Querying: Blend, explore and query data with ElastiCube — a highly performant database — without building dedicated OLAP cubes.
- Secure Write-Backs: Connect your Redshift database as a read-write repository using its Data Engine on Your Warehouse (DEYW) service.
Limitations
- The platform can be expensive for SMBs due to high subscription costs.
Platform:
Company Size Suitability: S M L
TIBCO Data Science
It’s a data science deployment suite consisting of TIBCO Statistica, Spotfire Data Science, Spotfire Statistics Services and TIBCO Enterprise Runtime for R (TERR).
Team Studio is the workflow authoring module for data scientists and non-technical users. Data modeling and automation accelerate the time to insight.
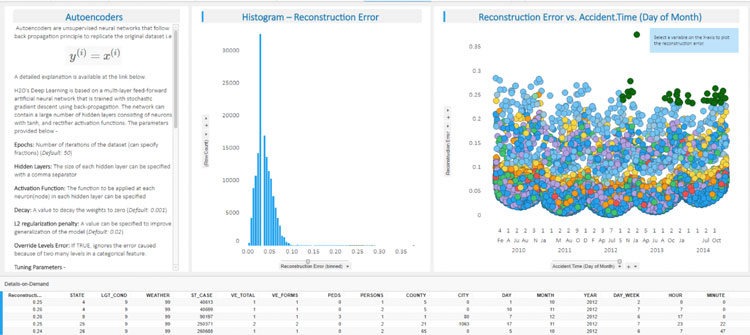
Deep learning enables guided template anomaly detection. Source
Top Benefits
- Boost Revenue: Streamline operations with workflow documentation, and improve your bottom line by incorporating predictions and prescriptions into analyses.
- Gain Full-Featured Analytics: Acquire real-time insight with hyper-converged analytics — data science, streaming capabilities and visual analytics — in one application. Incorporate predictive, prescriptive and text analytics into your data.
- Derive Useful Insights: Interactively discover actionable insights by providing sandbox environments and design models without IT involvement.
- Build End-To-End Data Pipelines: Use AI-ML to create, train and deploy analytical models. Automate ML workflows and drag and drop code from Jupyter Notebooks into Team Studio.
- Incorporate IoT Insights: Act immediately on insights at the data source — remove the need for streaming data to a centralized server.
Primary Features
- Team Studio: Access ready-to-go ML and data prep flows or create your own using a drag-and-drop interface or Jupyter Notebook integration.
- Statistica: Build advanced analytics workflows using over 16,000 functions.
- TERR: Deploying predictive models with API integrations using the vendor’s statistical engine.
- Advanced Analytics: Combine the functionality of Amazon SageMaker, Microsoft Azure, Google TensorFlow, Algorithmia, Azure ML and Apervita in one workflow.
- Parallel Computing: Send computing jobs to Apache Hadoop, Spark or various databases — no need to move the data.
Limitations
- Platform costs can be prohibitive.
Platform:
Company Size Suitability: S M L
SAS Visual Data Mining and Machine Learning (VDMML)
It’s the ML and data mining tool of SAS Viya, allowing you to define dataset associations with a button aptly titled “Build Models” on the interface. It enables interactive data prep, modeling and reporting within the SAS Viya HTML5 interface.
Machine learning drives automation, recommendations and natural language processing. Python-Jupyter integrations enable deep learning, computer vision and speech processing.

Building models in SAS Viya. Source
Top Benefits
- Plan: Encourage your data teams to innovate — free them from data management and analytics tasks. Save time by automating data discovery and preparation.
- Get the Complete Picture: Incorporate text and location-based information. Enable click-based predictions, goal-seeking and what-if analysis.
- Manage Data Effectively: Provide multi-user data access simultaneously and enable faster calculations by distributing compute jobs across nodes.
- Improve Decision-Making: Make informed decisions with effective BI, fast computing and proactive responses to data changes.
- Deploy Quickly: Implement on any environment — the solution also runs on Cloud Foundry as a platform-as-a-service (PaaS).
Primary Features
- Model Assessment: Identify commonalities across models and automatically generate their assessment results.
- Convey Insights: Communicate project status to team members and clients by generating easy-to-understand text summaries.
- Model Studio: Embed source code within analyses or call open-source algorithms in pipelines using a common interface. Transform, augment, join and explore data within the Model Studio.
- Deep Learning: Drive high-level APIs for deep learning, computer vision, forecasting, speech processing and natural language querying. Use SAS Deep Learning for Python (DLPy), an open-source package on GitHub.
- Automated Insights: Develop predictive and prescriptive algorithms, including decision forests, neural networks, support vector machines and Bayesian networks.
Limitations
- The system doesn’t provide automated anomaly alerting.
Platform:
Company Size Suitability: S M L
FAQs
What’s the difference between classification and clustering?
They are distinct techniques in BI and data analytics. Classification involves defining attributes and training data models to group new, unknown datasets with those qualities.
Do you ever notice when online forms automatically assign the area code upon entering the city name?
It is the supervised learning technique behind the scenes — data scientists define the variables “city” and “area” and assign them the area codes as classes.
They train the classification model to predict the area code upon entering new city and area names.
Pattern identification drives customer segmentation based on their buying propensities. Insurance and loan companies use classification techniques to flag fraud and track claims.
From retail to entertainment, companies customize their offerings to keep customers coming back for more. Netflix and Spotify show recommendations suited to your personal preferences — it’s data mining at work with classification in the background.
In contrast, clustering is a descriptive technique to group similar datasets based on their commonalities or differences. It’s an unsupervised technique with no training algorithms or predefined classes.
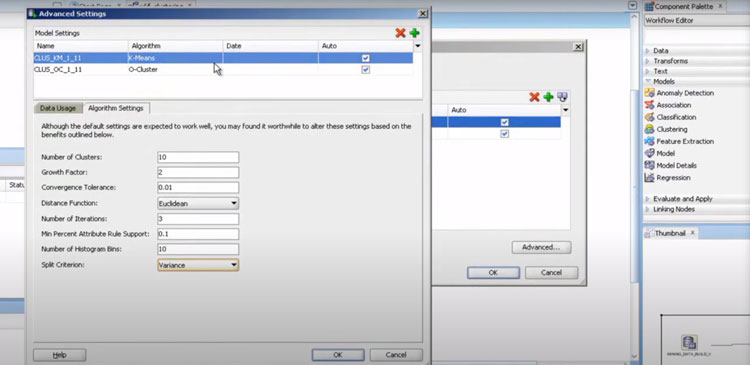
Defining the clustering algorithm settings in Oracle Analytics. Source
What’s the difference between data mining and preparation?
Data mining is the next step after data preparation which involves preprocessing, profiling, cleansing and transforming raw data for data mining and analysis.
Though many BI and reporting tools have end-to-end data management, dedicated data cleaning and profiling tools are available.
Data mining involves identifying the patterns in data after it’s preprocessed and clean.
What are the applications of data mining?
Machine learning, automation and natural language processing make pattern identification easier and faster.
- By classifying datasets, you can understand customer preferences and market trends and position your product accordingly.
- It increases your chances of improving sales and boosting your bottom line.
- You can learn what’s wrong with your business — maybe you’re leaking money due to loan or insurance fraud.
But data volumes can become unmanageable without the right data mining software.
Next Steps
A team is only as good as its players, and the same is true for your analytics software stack. Having the best source connectivity and visualization capabilities is never enough.
If you can’t derive useful information from large data volumes faster than the speed of thought, you’re losing to the competition. An efficient data mining tool is the answer, and your software search starts here.
Need help getting started? Generate a free comparison scorecard of the leading systems on your list and see how they fare for over a hundred functional and technical requirements.
Which data mining tool do you use? Which business needs did it address? Feel free to let us know in the comments below!
Analyst-Picked Related Content
Pricing Guide: Discover the true cost of BI software
Comparison Report: An Interactive analyst report with comparison ratings, reviews and pricing
I am text block. Click edit button to change this text.

2 comments
Join the conversationTADELE Deressa - July 10, 2021
I was satisfied..thanks a lot !!
Hsing Tseng - July 26, 2021
Thanks for reading! We’re glad you found this post helpful.