Is your data scattered to the wind with no way to make sense of it? Are legacy reports eating into your time without giving returns? You don’t have to stick with your current system if your business is suffering.
Modern BI tools come in various flavors and forms, and dashboard software is one such category of solutions.
This article discusses the benefits and features of the best dashboard software and answers common questions about visual analysis tools.

Article Roadmap
Dashboard software solutions are computer programs for creating, displaying and managing easy-to-understand visual representations of metrics, specifically key performance indicators (KPIs).
These are visual BI tools, often with end-to-end data management baked in. Which other features are worth considering?
Best Dashboard Software Tools
Our analyst research shows the following solutions are the top five dashboard software platforms.

Tableau
It’s a leading business dashboard software and a big data visualization tool with branding, drag-and-drop interactivity and seamless model import-export. This dashboard software platform supports auto charting via the ShowMe feature.
You can schedule source extracts and dashboard refreshes or auto-update them using an open-source utility, AutoHotKeys. Dashboards update as the underlying workbooks refresh on the server or online service.

Tableau provides 16 zoom levels for location insights.
Highest Rated Modules According to Our Data
- Dashboarding and Data Visualization — 100
- Data Management — 100
- Geospatial Visualizations and Analysis — 100
- Data Querying — 99
- Reporting — 93
Top Benefits
- Get Comprehensive Insights: View the complete picture by connecting to your preferred sources. This reporting dashboard software connects to all leading sources and is famous for visual insights.
- Gain a Competitive Advantage: Stay ahead by combining data science and visual analytics. Get consistent performance with live connectivity and in-memory processing.
- Democratize Data: Make data accessible with its user-friendly, intuitive interface. Share dashboards with internal teams and clients via website embedding, email and standard download formats.
- Stay On Top of Your Data: Access content on mobile — view dashboards published to your Tableau Server or Cloud instance when away from the office.
- Try for Free: Get a 14-day trial of the full-featured platform.
Primary Features
- Command-Line Data Extract: Automate refresh tasks by running the instructions from the command line.
- Statistical Functions: Analyze datasets using several functions, including ATTR, AVG, COUNTD, MAX, MEDIAN, MIN, PERCENTILE, SUM and VAR.
- Date-Time Functions: Calculate period-over-period growth and moving averages with built-in time-based functions.
- Ask Data: Get plain-text answers to data queries, adjust them as desired and watch the linked visualizations change.
- Tableau Prep: This reporting dashboard software has a dedicated module for workflow building and execution makes life easier.
Limitations
- Doesn’t support voice searches.
- Doesn’t support column-level security out of the box.
Features Not Fully Supported According to Our Data
- PMML — Not Supported
- Regression Analysis — Supported With Workarounds
- Sentiment Analysis — Supported With Custom Development
- Voice-Based Natural Language Search — Not Supported
Platform:
Company Size Suitability: S M L
SAP Analytics Cloud
SAP Analytics is a dashboard reporting tool that provides advanced visualizations, embeddable dashboards and predictive analytics with machine learning. You can make the dashboards your own with intelligent auto charting, branding and KPI configuration.
The application is available on many devices, and printed reports are available via Crystal Reports, a product from the same vendor.

A pixel-perfect canvas layout in SAP Analytics Cloud. Source
Highest Rated Modules According to Our Data
- Data Management — 100
- Dashboarding and Data Visualization — 99
- Reporting — 93
- Advanced Analytics — 88
- Data Querying — 88
Top Benefits
- Make Informed Decisions: Build plans with complete confidence in your data. Never depend on guesswork again — choose the best way forward with accurate information.
- Boost Efficiency: Do more with intelligent analytics and collaborative features. Keep teams on the same page by adding plain-text summaries to data stories.
- Get Answers Independently: Get back your time — delegate line-of-business decisions to departmental executives and managers. Empower your users to derive helpful insights with natural language queries.
- Preempt Risks: Anticipate and avoid risky investment decisions with predictive forecasting. Take proactive action when metrics exceed acceptable values — configure alerts to get notified about data changes.
- Complement Your Tech Stack: Buy trusted apps from SAP’s digital marketplace, SAP App Center. Choose from 1,500 partner solutions with the power of SAP Commerce Cloud and SAP Cloud Platform Integration Services.
Primary Features
- Search to Insight: Obtain sales figures and actuals vs. forecasted values for specific measures and periods. The system auto-completes the names and values of dimensions and measures as you type them, even synonyms.
- Intelligent Data Discovery: Determine the key influencers for your target metrics and view how variables impact outcomes. Spot anomalies with charts and natural language processing (NLP).
- Smart Predict: Predict future trends and events using classification, regression and predictive scenarios.
- Explorer: Discover ad hoc insights — launch the Explorer function in any visualization to analyze measures and dimensions.
Limitations
- Offers limited support for regression analysis.
- Doesn’t allow acting on insights from the host application when embedding dashboards.
Features Not Fully Supported According to Our Data
- Regression Analysis — Moderately Supported Out of the Box
- Sentiment Analysis — Supported With Partner Integrations
- Text Mining — Supported With Partner Integrations
- White Labeling — Not Supported
- Geocoding — Supported With Additional Modules
Platform:
Company Size Suitability: S M L
Yellowfin
It’s dashboard reporting software with automated analysis and data storytelling. The platform has a free-form, pixel-perfect canvas layout for designing infographics and dashboards embeddable into third-party platforms.
Built-in interactivity with helpful tooltips, time-based animations, auto charting and autorefresh are available. You can format headers, footers, colors and fonts via the Configuration and Report Styles option.
Besides Python/R integrations, D3 and Google Charts enable building advanced visualizations using JavaScript libraries.

Ask plain-text questions with guided plain-text querying. Source
Highest Rated Modules According to Our Data
- Data Management — 100
- Dashboarding and Data Visualization — 96
- Reporting — 93
- Advanced Analytics — 88
- Embedded Analytics — 88
Top Benefits
- Get to Market Fast: Save time and resources with its user-friendly interface and embedding options. View Yellowfin content in your systems or vice-versa with minimal developmental effort.
- Manage Data: Connects to databases, spreadsheets and cloud services with security, data governance and quality compliance.
- Derive Helpful Results: Convey your message while the data is fresh, thanks to fast recommendations, predictive analytics and anomaly detection.
- Scale Flexibly: Grow your tech stack as the business expands. Extend its functionality with ready-to-go integrations, connectors and extensions, and customize the platform.
Primary Features
- Data Transformation Module: Get data ready for analysis — extract, transform and store it in a repository using drag-and-drop transformation workflows.
- Yellowfin View: Define relationships and field formatting in an intuitive data preparation area, the Yellowfin View, without decoding the business logic.
- Multidimensional Analysis: Get results fast with in-memory data analysis, removing the need for ETL or OLAP cube building.
- Assisted Insights: Its report builder autogenerates contextual insights after accepting inputs, thanks to the Insight Wizard. Compare data points and interpret what you see with its automated analysis and insight rankings.
- Embeddable Actions: Add your workflow logic to dashboards — dive deeper by opening linked reports, additional dashboard tabs and external URLs. You can access customer records from your CRM tool, and write back to applications.
Limitations
- Doesn’t support sentiment and text analysis out of the box.
- Doesn’t support voice searches.
- Doesn’t provide database write-backs.
Features Not Fully Supported According to Our Data
- PMML — Supported With Partner Integrations
- IoT Analytics — Not Supported
- Voice-Based Natural Language Reports — Not Supported
- Text Mining — Supported With Partner Integrations
- Sentiment Analysis — Supported With Partner Integrations
Platform:
Company Size Suitability: S M L
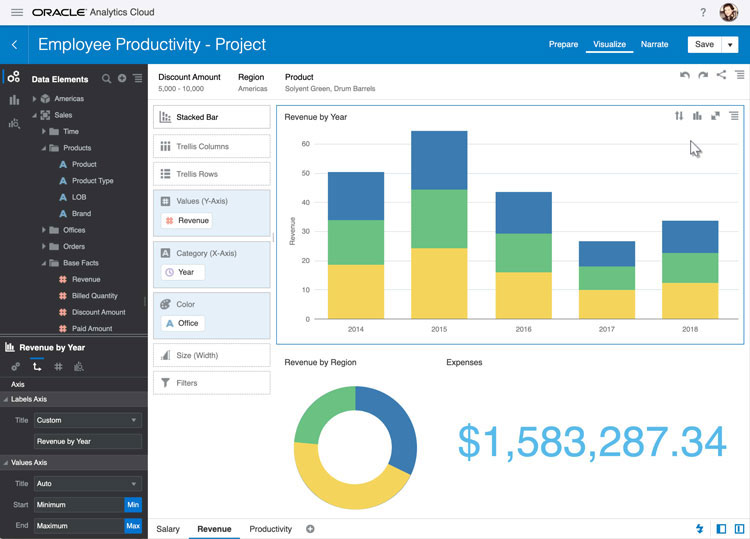
Oracle Analytics Cloud (OAC)
Oracle provides decision support to customer experience, ERP, HCM and SCM companies with over 1,000 analytics applications. Powerful dashboards include multiple-page displays with advanced, embeddable visualizations.
Oracle partners with Yseop for natural language processing. The vendor provides custom plugins for animations, auto charting and data auto refreshes. The platform offers several visualizations, thanks to D3 and Google Charts integrations.

Oracle Analytics prepares, visualizes and narrates data on demand.
Highest Rated Modules According to Our Data
- Data Management — 100
- IoT Analytics — 100
- Dashboarding and Data Visualization — 94
- Advanced Analytics — 91
- Reporting — 85
Top Benefits
- Make Data-Backed Decisions: Oracle provides modern visual analytics for independent data prep and wrangling. The platform can draw data from on-premises, cloud and hybrid systems.
- Boost Productivity: Accelerate analytics at a cloud scale with Oracle’s in-memory technology. The vendor provides packaged analytics within your business systems.
- Find Answers: Get answers to plain-text queries — enter attributes, measures, chart types and functions, and generate visualizations by typing out a term in its ubiquitous search bar, thanks to machine learning.
- Leave No Data Behind: Gain a 360-degree business perspective with a single-data view. It’s a highly performant platform with elastic data storage and enables analytics for citizen data scientists, executives and business users.
- Share Insights: Publish visualizations, canvases and dashboards to Twitter, Linked, Slack, the Oracle Social Network (OSN) and Oracle Content and Experience (OCE) with this dashboarding software.
Primary Features
- Prediction Algorithms: Create Python-R scripts and custom data models with Oracle Analytics. The platform offers several algorithms for numeric predictions, including simple linear regression and classification and regression tree (CART).
- What-If Analysis: Perform scenario testing and prediction analysis by inputting and adjusting variables with this business dashboard software.
- Time-Series Analysis and Forecasting: Create time series models using exponential smoothing or Seasonal ARIMA (Autoregressive Integrated Moving Average) using Oracle’s Forecast function.
- Machine Learning Insights: OAC generates predictions on demand after automatically segmenting and clustering values in a dataset. Additionally, it provides contextual insights, key driver analysis, and voice and text searches.
- Explain Module: Gain valuable insights about selected data using the Explain option — the system automatically generates suitable visualizations.
Limitations
- Small and mid-sized businesses may find it expensive.
Features Not Fully Supported According to Our Data
- PMML — Supported With Additional Modules
- Text Mining — Supported With Additional Modules
- Sentiment Analysis — Moderately Supported Out of the Box
- Integrated Workflow Actions — Not Supported
- White Labeling — Not Supported
Platform:
Company Size Suitability: S M L
Domo
It’s an end-to-end BI platform with data integration and analytics built in. Embeddable dashboards with intelligent search and visualization recommendations accelerate insights in this dashboard reporting software.
Domo has a comprehensive toolkit with R and Python integrations, animations, the Analyzer tool, page layout suggestions, templates, and custom charting options. Mobile insights are available, and a native collaboration platform keeps teams connected.

A doughnut chart of the top sales by source.
Highest Rated Modules According to Our Data
- Data Management — 100
- IoT Analytics — 100
- Dashboarding and Data Visualization — 94
- Advanced Analytics — 91
- Reporting — 85
Top Benefits
- Leverage Data Science: Get a full-stack data modeling and analytics suite using AutoML, Jupyter Notebooks and ChatGPT — no need to acquire additional BI tools with this dashboard reporting tool.
- Track Customer Engagement: Drive customer retention and upsell at the right time with buyer analytics. Personalize buyer interactions with buying history, website visits and payment behavior data.
- Anticipate Employee Churn: Act to retain employees or prepare to hire additional staff by predicting employee turnover. Calculate how long potential hires will stay by inputting their information into your formulas.
- Mitigate Risk: Keep your business safe by reducing the number of loan defaults. Factor in historical data and credit scores to avoid lending to applicants likely to renege on payments.
- Manage Inventory: Meet customer demand and adjust stock levels according to market conditions with forecasting with this business dashboard software.
Primary Features
- Clustering: Compare sales across products and stay informed about customer segments with the highest revenue potential or churn. Identify trends with ML-driven feature selection and clustering analysis.
- Beast Mode: Create dynamic, calculated fields with Domo’s advanced query authoring interface that provides formula autocompletion. Include calculated columns in your tables and dashboards with one-click selections.
- Magic ETL: Empower your non-technical users to perform data extraction and transformation with drag-and-drop actions. They can schedule data pipeline runs, combine columns, add new ones, filter rows and map values across columns.
- Domo Insights: Grant personalized data access to users with row-level governance with this dashboarding software. Match dashboards to the company’s brand with customized themes and embed them into client apps.
Limitations
- Doesn’t support PMML.
- Doesn’t provide voice searches.
Features Not Fully Supported According to Our Data
- Text Mining — Supported With Workarounds
- Live Connections — Not Supported
- Geographic Search — Not Supported
- Integrated Workflow Actions — Not Supported
- Offline Mobile Mode — Not Supported
Platform:
Company Size Suitability: S M L
FAQs
1. What are the key features to consider when purchasing dashboard software?
At the very least, you’ll need data integration and visualization libraries, but which ones will be useful and in which scenarios? Doughnut charts are excellent visual aids, but not always. They aren’t ideal for displaying several data points and progression over time.
What else?
- End-to-end data management.
- Real-time updates.
- Customization.
- Readymade widgets and templates.
- Data security.
Interactivity — filtering, drilling down and highlighting — and personalization may cost extra, but they add value. Here’s what else you might need for big data analytics.
- Live source connectivity.
- Advanced analytics.
- Augmented analytics with automation, machine learning and NLP.
- IoT, edge and streaming data analysis.
2. What are the different types of dashboard software available?
BI software provides actionable insights and decision support by analyzing historical and current data. Tableau, Power BI and Looker are examples.

Boost your revenue streams by embedding analytics into your workflows. Source
Data visualization tools enable insight interpretation by representing complex data in graphical formats. Examples include D3.js, Plotly and Chart.js.
- Reporting Platforms: They support decision-making with tables, charts and data visualizations. Examples include Google Data Studio and Zoho Analytics.
- Open-Source BI Software: They are free, customizable tools for analyzing and visualizing data for business intelligence. Grafana, Metabase and Redash are examples.
- Real-Time Dashboard Software: They display accurate, up-to-date information visually. Examples include Datadog and Geckoboard.
- Custom Dashboard Solutions: They allow organizations to create tailored data presentations. Trello and HootSuite are examples.
- Embedded BI Platforms: They provide data access within routine workflows by integrating seamlessly into business systems. Examples include Tableau Embedded and Looker Embedded.
- Mobile Dashboard Software Tools: Get on-the-go access to metrics and key performance indicators with mobile dashboards. Klipfolio for Mobile and Power BI Mobile are examples.
3. What are examples of custom dashboard solutions?
Dashboards are a popular medium for conveying and interpreting information across departments and industry verticals.
- Sales Dashboards: They are visual representations of sales revenue (leads, actual and forecasted), customer churn rate, percentage of qualified leads, sales opportunities and deals in the pipeline.
- Project Management Software Dashboards: They provide centralized views of ongoing projects, resources and timelines. Examples include Trello and Asana dashboards.
- Financial Management Software: Financial dashboards support decision-making with user-friendly views of financial transactions, budgets and financial reporting. Bloomberg Terminal and Yahoo Finance are examples.
- Manufacturing Software Dashboards: They provide insights into production processes, equipment status, inventory levels and system performance. Examples include Oracle ERP Cloud and SAP S/4 HANA.
- Ecommerce Software Dashboards: They help track online sales by displaying key commerce metrics, including sales, conversion rates, customer trends and inventory levels. SAP ERP and QuickBooks Online are eCommerce tools.
- Patient Management Software: Healthcare dashboards present data on appointment histories, patient information, diagnoses and billing. Examples include NextGen and eClinicalWorks.
- Learning Management Software: LMS dashboards allow online course creation, content management and monitoring of course completion rates, exam scores and attendance. Examples include Moodle and Google Classroom.
- Social Media Marketing Platforms: Social media dashboards help track user trends and marketing campaigns on popular social platforms. Examples include Mailchimp and Pardot.
- Supply Chain Management Systems: They present comprehensive views of goods flow and finances from procurement to production to distribution. Examples include Oracle SCM Cloud and SAP Supply Chain.
Additionally, government dashboards show information about federal and state agencies, fostering accountability, openness, and informed decision-making. Dundas BI is an example.
4. What are the customization options available with dashboard software?
Branding and localization are helpful customization options, irrespective of your industry. What else might you need?
Convey insights clearly in an organized, clutter-free layout. Source
- Layout and grid control.
- Widgets.
- Interactive navigation and data manipulation elements.
- Conditional formatting.
- Responsive design for access across devices.
- Sharing in your preferred formats.
5. Are free dashboard software solutions available?
- Google Data Studio is free and open source and offers good source support and interactivity in dashboards.
- Grafana is free and open source, popular in the DevOps and IoT communities and excels in time-series visualizations.
- FineReport comes in free and paid versions and has excellent reporting capabilities.
DataBox, Cyfe, QlikView Personal Edition, Cluvio, Seal Report and Dasheroo are other examples.
6. How can I collaborate with my team and clients on dashboards?
Set up user accounts and permissions, whether embedding dashboards externally or offering them via client portals. Here’s what your dashboard software should allow you to do.
- Generate shareable links for account-free external-user access.
- Schedule delivery via email or other communication channels.
- Export and download dashboards.
- Annotate datasets and leave comments.
Here’s what you need.
- Version control.
- Integration with project management and collaboration tools like Slack and Microsoft Teams.
- Technical support and documentation.
7. How can I gauge if dashboards are successful in my organization?
Vendors like Salesforce support dashboard performance tracking — Tableau shows dashboard usage metrics on demand.
Are you worried about visibility? Often, users aren’t aware of the available dashboard types and features. Delivering dashboards to their inboxes is an excellent way to increase engagement.
According to Jakob Nielsen, co-founder of the Nielsen Norman Group and an internet-usability expert, a one-second response time is already too much, “and the user loses the feeling of operating directly on the data.”
- Are your displays loading slowly? Test run your dashboards to assess the response latency — many tools report on load times.
- Reducing the number of charts, filters and tiles may bring the load time down to an acceptable level.
- Converting data from strings to numbers can keep your dashboards lightweight.
Read our best practices article to maximize the impact of your dashboards.
8. How do I choose the right dashboard software for my business or project?
Selecting the right software doesn’t have to be overwhelming —- you need a systematic approach. Create a product shortlist by gathering the requirements, contacting vendors for information and ranking products by feature.
Need more information? Read our Lean Selection article for a step-by-step guide.
Next Steps
Slow-to-load dashboards and data integration complexities can frustrate users, delay projects and erode client trust in your ability to deliver. Popular dashboard platforms have several shiny features, but do you need them all?
How do you find a solution that is just right? Get our free requirements template to list features that matter to you and select a best-fit dashboard software system without breaking the bank.
What are your visual analysis needs? Which features matter the most to you? Let us know in the comments.
Analyst-Picked Related Content
Pricing Guide: Discover the true cost of BI software
Comparison Report: An Interactive analyst report with comparison ratings, reviews and pricing

Leave a Reply