Best Embedded Analytics Tools

Embedded analytics tools (embedded BI) are solutions made to integrate seamlessly with business applications and provide analytics capabilities to engage users where they are allowing them to dig into proprietary data to glean meaningful insights.

Buyer's Guide

Last updated on October 10th, 2023
Embedded Analytics Tools Are All About Insight at Your Fingertips

Embedded Analytics BG Intro

Embedded analytics addresses the last mile of insight — delivering information where it matters. The technique drives business growth with on-demand visibility into metrics.

At-hand information with embedded analytics spurs operational improvements and long-term strategy, including diversification planning.

Looking for a better way to manage your analytics needs? This buyer’s guide breaks down embedded BI, how it can help you succeed and how to pick the best solution.

Executive Summary

  • Embedded BI solutions deliver data to end users on demand without switching contexts when working within their business platforms.
  • They maximize your investment by minimizing risk, boosting efficiencies and supporting business forecasting.
  • Know your implementation goals and the key features of embedded analytics tools for a fruitful software search.
  • Self-service analytics, end-user development, open APIs and artificial intelligence (AI) are current embedded business intelligence trends.
  • Ask questions internally and from vendors to learn about products, implementation support and post-sales services.

What Is Embedded BI Software?

Embedded BI software are programs that provide business intelligence and analytics within enterprise applications and workflows. Embedded BI solutions deliver ready insight, presenting it in a user-friendly format.

Dashboards are interactive but not actionable. You can move the data points around to derive insight, but taking action is another thing.

The inventory dashboard tells you stock is surplus for specific items, but you can’t pause or modify orders from there. You’ll need to navigate to the order workflow in your procurement software to do it.

Embedded analytics tools present your inventory report within your order workflows, enabling proactive action when needed. It’s the same for the various industries and domains it serves.

Depending on who you are, embedded BI solutions benefit you in different ways.

  • As a vendor, you can save money by adding analytics to existing software — no need to start from scratch. Advanced offerings can differentiate you from the competition in your industry.
  • As a buyer, you don’t need to invent the wheel — embed analytics within your systems. Ask potential vendors if their products will work with your tech stack.
  • As an end-user, you get ready-to-go insight with data management and preparation capabilities.

With the required information at hand, you can save time and make informed decisions in the moment. In addition to following a strategy, you can course-correct if the current approach doesn’t serve your business.

Primary Benefits

Embedded business intelligence makes teams more productive with streamlined workflows and less context switching. Greater transparency into data helps spot opportunities and potential risks.

Primary Benefits of Embedded Analytics

Maximize ROI

White label an embedded BI solution to achieve revenue targets — provide metrics to end users without knowing they’re accessing an embedded program. You can act upon insights via interactive workflows within your routine processes.

Embed customer analytics — combine data from multiple user touchpoints into your BI system with embedding APIs. Retail, healthcare, finance, and consumer goods and services use in-app insight routinely.

Managing internal operations becomes easier with an embedded ERP (enterprise resource planning) solution. ERP includes accounting, supply chain, inventory, marketing automation and workforce management.

Minimize Risk

Embedded business intelligence solutions protect sensitive data by complementing security with robust architectures. Activity monitoring keeps track of data access and reporting tasks and who performed them. 

Embedded BI solutions have rich visualizations highlighting discrepancies and outliers, including the top performers. 

Outliers in data can indicate problems in operations like low stock, faulty items and falling sales. Setting KPI alerts helps minimize risk and gives you time to act.

Boost Efficiency

Embedded workflows help you maintain focus by keeping you within your primary workflows. They’re user-friendly, so anyone with basic data interpretation skills can connect the dots by establishing associations between complex data sets. 

Self-service BI is a big part of embedded tech, helping you engage better with data without analyst skills.

Embedded analytics SaaS (Software-as-a-Service) solutions came through during the 2019 pandemic.

Mike Brody, CEO of Exago, an embedded SaaS software vendor, said their company adapted quickly to the transition to remote work.

“In many ways, we’re more effective than we were before. COVID didn’t stop a lot of people, especially in the software industry. One-third of our company is now permanently remote; our staff works as effectively as if they were in the office next door, and we’ve increased our pool of great employees around the country.”

Predict Trends

Forecasting business trends with data science gives you the confidence to plan instead of relying on experience or guesswork. Embedding analytics systems into your business lets you build predictive data models from your preferred platforms.

Predictive analytics works with AI algorithms. The more data you feed them, the more accurate the results will be. You can include historical data in your forecast, besides seasonality, geographical data and weather metrics.

Anticipating product demand and supply chain issues is critical to ensure you’re not left hanging. Visualizing your project load for the foreseeable future can help you decide whether to hire more people.

Embedded Analytics Tools Report

Expert recommendations and analysis on the top Embedded Analytics Tools

Get free access now

Implementation Goals

When buying embedded BI solutions, it’s essential to list your organization’s goals to ensure successful implementation. These will vary from one business to another, depending on specific needs. We recommend performing an internal assessment of your business processes, projects and resources beforehand.

Goal 1

Boost Your Bottom Line

  • You want to earn more revenue by offering better products and services.
  • You hope to reduce costs and increase efficiency.
  • You wish to improve your company’s financial health.

Goal 2

Improve Customer Service

  • You want to maintain high product quality.
  • You wish to offer products that customers want.
  • You hope to attract more buyers and keep current customers happy.

Goal 3

Track Operations

  • You want operational insight on demand.
  • Data access on mobile devices should be available.
  • You want KPI alerts if they exceed preset values.

Goal 4

Forecast Trends

  • You wish to improve processes today to get the desired outcome.
  • You hope to manage risk better by anticipating when something might go wrong.

Goal 5

Boost Productivity

  • You want in-app analytics and streamlined workflows for your teams.
  • You wish for your team to be self-sufficient in interpreting reports and dashboards.

Goal 6

Get Ahead of the Competition

  • You hope to take advantage of promising business opportunities.
  • You want to launch competitive products in the market at the right time.
Embedded Analytics Tools Report

Expert recommendations and analysis on the top Embedded Analytics Tools

Get free access now

Basic Features & Functionality

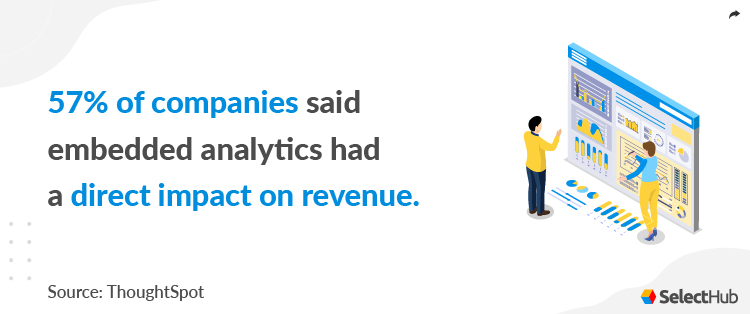
According to a survey in the ThoughtSpot product manager’s guide, 57% of the polled companies said embedded analytics directly impacted revenue. 61% said it boosted engagement.

Embedded Analytics Stat

Thinking about where to start? Let’s get acquainted with the basic features of embedded software to help finalize your requirements.

Developer Tools

An open architecture lets you add functionality to the platform. Some vendors offer open APIs without charging extra.

Pick-and-click toolkits and white labeling are other desirable features. Multi-tenancy support ensures login-based access to data while keeping other tenants separate.

Version control keeps your application compatible with the host application as it updates. Write-backs keep the database in sync with front-end information changes.

Source Connectivity

Relational and NoSQL databases, Hadoop, and CSV, Excel and XML files are common data sources. FTP and SFTP server compatibility enable file transfer across networks.

The solution must support JDBC, ODBC and parametrized connectors. Adding and setting up new information sources should be possible.

Data Management

The solution must provide data preparation with profiling, parsing and enrichment.

Quality management requires data governance, metadata and object-level access. Multidimensional data analysis, including OLAP, must be possible.

Embedded Visualizations and Dashboards

Ready templates and customizable widgets save you from starting from scratch when building dashboards. Animations show changes in data over time.

Auto-refresh keeps you informed about the latest metrics. Interactivity lets you dig deeper, while a rich graphics library gives more options.

View only the desired metrics while hiding the rest with selections and filtering.

Besides your internal software, visualizations must be embeddable into websites and applications.

Security

Role-based data access, single sign-on (SSO) and SAML must be available. Activity logs and login-specific IP locks enforce accountability and compliance.

Embedded Analytics Tools Report

Expert recommendations and analysis on the top Embedded Analytics Tools

Get free access now

Advanced Features & Functionality

If you plan to scale and have the budget, consider opting for advanced functionality. It can save you a tidy sum in the long run.

Embedded Reporting

Conventional reporting is still very relevant, but sometimes vendors offer it as a separate module at extra cost.

Opting for a vendor that includes reporting and dashboarding in the same package is cost-effective.

Often, vendors refer to dashboards as reports, so check what you’re getting and specify if you need both.

Customizable elements and formatting options can lend a professional look to dashboards. Scheduled report sharing gives you time for tasks that need human intervention.

You should be able to share reports as shareable URLs and email attachments and embed them into client applications.

Communication and Collaboration Tools

In-dashboard messages and comment threads help teams conduct meaningful data discussions. Email notifications are effective alerts for data changes and comments.

Availability

Though many vendors promise 100% availability, it’s better to cover your bases by asking about failsafe mechanisms. How does the vendor handle scheduled maintenance?

What happens if the application crashes? Are backup services and data caching available?

Mobile Support

Mobile updates help you stay on top of trends. Check with stakeholders if it’s a deal-breaker.

If yes, ask vendors if the solution is available via a mobile browser and app. You should be able to receive updates on your mobile email client.

Sending reports and dashboards as email attachments and viewing them on your phones, laptops and tablets should be possible.

Augmented Analytics

AI, machine learning (ML) and NLP enhance data analytics with self-learning algorithms and plain language searches.

They help you prepare, analyze and visualize data to pull it into dashboards and reports. Automated workflows free you from repetitive tasks.

IoT Analytics

IoT data comes from physical devices remotely connected to the internet for obtaining personal or business insights.

Enterprise IoT devices include construction and mining machinery, transport vehicles, and oil, gas and power utilities. Is this you?

Look for an embedded analytics system that gathers data from remote systems.

Pushing updates to these physically distant systems is another matter — ask the vendor if it’s part of the functionality.

Embedded Analytics Tools Report

Expert recommendations and analysis on the top Embedded Analytics Tools

Get free access now

Current & Upcoming Trends

Embedded analytics is a game-changer for non-technical end users. It’s why self-service BI, end-user application development and AI are trending.

Embedded Analytics Trends

Self-Service Analytics

The need for shorter delivery cycles pushes enterprises to be more open with their data. They’re aware that the benefits of making information available to all outweigh the security risks. Besides, security and governance protocols help plug any gaps.

This demand for data democratization drives vendors to offer autonomous embedded platforms with help from augmented analytics.

It boosts employee engagement and productivity, helping enterprises stay competitive. Self-service analytics is a must-have feature and will continue to trend for years.

Citizen Developers

Self-service isn’t limited to deriving insight. Now you can develop software programs using simple user actions — no code involved. You can be a citizen developer, building apps using SDKs (software development kits) and app designing wizards.

Gartner defines a citizen developer as “an employee who creates applications for their own use or for others, using tools approved by the business.”

End-user development can reduce costs —- public APIs make embedding possible, whether it’s specific content or a complete analytics program. Security and compliance oversight is a must, but it’s working.

Who better than a business user to know what type of app they need?

Will citizen data scientists replace developers? It doesn't seem likely, with digital transformation becoming more niche. But citizen development is here to stay, with employees becoming more tech-savvy.

Open Platforms

Embedded tools rely on an open architecture to integrate with various applications and scale as data requirements change.

These integrations are loosely coupled software modules — you can modify the solution without affecting the other components. Javascript APIs bridge the back and front ends, letting you build from an intuitive HTML5 interface. 

At the front end, white labeling the embedded solution to your brand is a simple, one-click selection. Additionally, vendor plug-ins for transformations, formulas, visualizations, report export and user account management facilitate analytics.

Vendors should offer robust and resilient open APIs that can withstand technology changes.

Embedded AI

AI with embedded analytics — embedded AI — is currently big, abstracting queries with plain text responses and automating processes. While AI is the technology, machine learning is how you do it.

Machine learning also serves prescriptive analytics, helping you decide the next action.

Speaking of embedded intelligence, generative AI is currently a hot topic of discussion. From research tools to image and content generation, AI is a part of our lives now more than ever.

But enterprises are cautious about its usage as it’s not that great with data security.

The technology needs stricter guardrails to prevent sensitive data from being exposed publicly. User management and authentication systems have a lot of catching up to do.

Though embedded AI is yet to mature regarding security, it’ll continue to disrupt software development and data analytics.

Cost & Pricing Considerations

According to the ThoughtSpot survey, 78% of users said customization is the primary requirement when seeking in-app analytics. 52% of users rated autonomous data discovery as business-critical.

These findings confirm that tailor-made solutions are a high priority for companies.

Build or Buy?

If you’re considering developing in-house, consider this.

  • Developing an analytics solution from scratch is costly, and getting executive buy-in can be challenging.
  • Differentiating the product to stand out from the competition takes time. Keeping up with feature requests can slow down the time-to-market.
  • Generating revenue isn’t easy when the competition offers equally good or better products.
  • Finding skilled developers can be difficult.

Buying a software solution may be more practical.

If you want CRM analytics, should you look for an embedded BI tool or an embedded CRM system?

Consider your business needs, how the two tools deploy with your tech stack and which features they provide.

Licensing Options

  • For on-premise versions, the cost of ownership may be high, and maintenance, customization and upgrades are your responsibility.
  • SaaS software versions are available for a monthly or annual subscription fee. They’re lightweight and accessible from anywhere with an internet connection.

Pricing may be user, query, core or workspace-based.

  • How many people will use the program? User-based pricing might fit you if you’re not planning to expand soon.
  • How often do you need analytics? Query-based pricing can help you keep prices in check.
  • Core-based pricing fits teams with fluctuating workloads, allowing them to pay only for usage.
  • Workspace-based pricing might be for you if delivering analytics to external users and clients is a crucial requirement.

Many vendors offer tailored pricing, a mix of two or more options. Research your vendor — check online reviews, read industry guides and ask colleagues for recommendations.

Get our free embedded analytics pricing guide for cost estimates.

Additional Considerations

Ask for free trials, demos or proofs-of-concept to check product usability.

Often, basic support and training are included in the product package. Dedicated assistance and tailor-made training may cost extra.

Follow our Lean Software Selection methodology to procure a suitable solution.

Price Guide for Embedded Analytics Software

See prices for the top Embedded Analytics Software... Plus get important questions to ask.

Get Prices Now

The Best Embedded Analytics Software

Now that you know what embedded analytics tools can do, how do you decide which product is best? Check out our top picks below!

Embedded Analytics Tools Leaderboard

Dundas BI

It’s a browser-based analytics platform that embeds using server and client APIs (application programming interfaces) and authentication protocols. The vendor offers reports and dashboards in one solution at no extra cost.

Dundas BI

Gain instant insight with embedded analytics. Source

What It Does
  • The platform enables building data models for segmentation, regression and what-if analysis.
  • The embed code can incorporate functions, transforms, controls, visualizations, and data, export and delivery providers into your tech stack.
  • You can build formulas, transformations and calculations using DundasScript.
  • The solution enables embedding a screen or the entire application.
  • Animations, pre-built templates and widgets help create pixel-perfect dashboards with various visualizations.
Pros and Cons from User Reviews
Pros Cons
An open architecture enables the platform on many browsers and devices without downloads. There’s a steep learning curve.
The platform is customizable, with creative control over visualizations. The platform can slow down when processing complex data volumes.

Free Trial? Yes

User Sentiment Score: According to online reviews, 89% of users recommend this product.

MicroStrategy

It’s a data analytics solution that embeds into many BI systems, including Power BI and Tableau. Native and custom connectors draw data from over 100 sources, including ERP, CRM and other BI tools.

MicroStrategy Analytics

Embedded technology shows information about data points upon hovering. Source

What It Does
  • Automated data preparation workflows are available.
  • MicroStrategy dossiers are interactive displays that enable real-time transactional data analysis.
  • A Chrome extension, HyperIntelligence, provides information upon hovering over data points on search pages and websites.
  • Voice-enabled assistance, AI and natural language processing (NLP) drive predictive analytics.
Pros and Cons from User Reviews
Pros Cons
More than 80% of users praise its visualization and reporting capabilities. The platform can be slow as it’s memory-intensive.
You can sign up for a full-platform 30-day trial. Small and mid-sized businesses may find it expensive.
The vendor provides built-in provisioning for Azure and AWS servers. There’s a steep learning curve.
It’s mobile-responsive. Implementation is time-consuming.

Free Trial? Yes

User Sentiment Score: According to online reviews, 82% of users recommend this product.

Zoho Analytics

A versatile customer analytics platform, Zoho Analytics can function as a standalone and embedded analytics tool. Self-service visualization and reporting are available on desktop and mobile.

Zoho Analytics

Subscription management is key for online service providers. Source

What It Does
  • Native connectors draw data from files, cloud storage, databases, CRM, marketing, social media, eCommerce and HR platforms.
  • Interactive maps enable geo-visualization.
  • Zoho’s AI chatbot and digital assistant, Ask Zia, responds to plain text queries and automatically builds KPI widgets and visualizations.
Pros and Cons from User Reviews
Pros Cons
The vendor provides a fast-deploying customizable, no-code and white-label solution. There’s a steep learning curve.
Generating dynamic, customizable reports is straightforward. Composing and joining queries is limited.
Zoho Analytics deploys seamlessly, integrating with many platforms and databases. Too many options on the interface can be confusing.

Free Trial? Yes. A forever free version is available for individual use.

User Sentiment Score: Per online reviews, 89% of users would recommend this product.

Tableau

An Embedded API drives the Tableau Embedded Analytics solution. It includes a server license and access to all APIs and capabilities. Maintenance, support and upgrades are part of the product package.

Usage, role and core-based licenses are available.

Tableau

Geo-visualization in an aviation dashboard. Source

What It Does
  • Tableau supports many visualizations out of the box.
  • Built-in KPIs (key performance indicators) get you started quicker.
  • Its AI-driven module, Ask Data, answers plain text queries with suitable visualizations and recommendations for next steps.
  • You can edit visualizations and add sources and data fields.
  • The Embedded API enables user management.
Pros and Cons from User Reviews
Pros Cons
A REST API integrates your application with Tableau, enables access permissions and automates processes. The platform is expensive for individuals and small businesses.
Tableau supports several authentication options, including OAuth, Authorization Servers, SAML (Security Assertion Markup Language), OpenID and Kerberos via Active Directory. It struggles with processing sophisticated visualizations.
The vendor provides row-level data security. There’s a steep learning curve for complex functionality.

Free Trial? Yes

User Sentiment Score: 87% of people reviewed online would recommend it.

Domo Everywhere

Domo’s embedded analytics offering has a new avatar, Domo Everywhere, launched in 2021. With the Publish and Embed modules, it enables delivering personalized data solutions to customers.

Domo Everywhere

Share relevant insight via public URLs with external users. Source

What It Does
  • Domo Everywhere provides custom experiences through intelligent apps, visualizations and native mobile capabilities.
  • Curated features enable dashboard sharing and collaboration.
  • It’s flexible — you can embed the Domo application into your app or website or insert Domo data directly using iFrames and JavaScript.
Pros and Cons from User Reviews
Pros Cons
The solution deploys at scale and leverages existing user management protocols. Installation and customization may require technical expertise.
It inherits Domo’s fast query performance. It can be costly.

Free Trial? Yes

User Sentiment Score: Not available.

Embedded Analytics Tools Report

Expert recommendations and analysis on the top Embedded Analytics Tools

Get free access now

Questions To Ask Yourself

Software selection is unique to each organization. What works for others might not be the best fit for you.

Ask these questions internally.

  • How many users will work with the solution?
  • Will they need training?
  • What are our current pain points? How do we expect the new solution to address them?
  • What are our analytics requirements?
  • Which self-service capabilities do we need?

Embedded Analytics Key Questions

Questions To Ask Vendors

Face-to-face discussions with vendors help fill in the gaps online research won’t. Prepare questions to get clarity about the products and services from vendors.

About the Software

Add these questions to your list.

  • Which integrations does the software offer?
  • Is automation available? To what extent?
  • Which security features does the software offer?
  • Is it compatible with my existing system?
  • How does your platform serve companies in my industry?

About the Vendor

  • Which customer support and training options do you offer?
  • How does your technical support team handle help requests?
  • How long does onboarding take?
  • What are the storage and processing limits?
  • How many years of expertise do you have in the industry?

FAQs

What are the types of embedded BI tools?

Here’s a list. Check out the product directories on our website for product pros and cons and user sentiment analysis.

What are some embedded analytics techniques?

You can embed content directly within websites and applications using iFrames and HTML code, but it may become clunky for large data sets. Missing interactivity and customization can make for a less-than-satisfactory experience.

Additionally, ill-secured web forms can expose sensitive data to third parties.

Opting for an open embedded analytics platform allows you to customize the platform to your needs. Many vendors offer basic customization to get you started.

You can ask them for custom functionality depending on who’ll use it.

  • Data consumers prefer ready reports and dashboards with personalized views and interactivity.
  • Content creators perform queries, make reports and dashboards and share insight with others.
  • Data analysts may need a blank canvas, often starting from scratch and connecting to their preferred sources.

Who are your end users?

Check out our Jumpstart platform for a score-based comparison of the leading embedded software.

Embedded Analytics Tools Report

Expert recommendations and analysis on the top Embedded Analytics Tools

Get free access now

Next Steps

Embedded BI tools drive business processes with comprehensive insight. On-demand information saves time, helping you focus on what’s important — steering your business to success.

To choose the right embedded business intelligence tool, create a requirements checklist of your must-have and nice-to-have features. Compare the shortlisted solutions based on how well they perform for each feature.

Shortlist five to seven systems, read user reviews, and request vendor price quotes and trials. Narrow your options based on price, UX, interface, support and other business needs.

Worried about how to go about it? Get started today with our free comparison report to gain insight into top software leaders.

Product Comparisons

Additional Resources

Looker

User Sentiment:
User satisfaction level icon: great

Looker is a web-based analytics solution that offers businesses the ability to explore, discover, visualize and share data insights. Enterprises can view data sources and drill down into data to better understand their business and metrics. Using a simple proprietary modeling language, this system helps define data relationships while bypassing SQL. It facilitates data literacy and accessibility, irrespective of technical skill levels. It was acquired by Google on June 6, 2019, for $2.9 billion.

PRICE
$
$
$
$
$
DEPLOYMENT
COMPANY SIZE
S
M
L
PLATFORMS

Request with no obligation:

PRICEDEMO

Cloudera

User Sentiment:
User satisfaction level icon: great

Cloudera is a multi-environment analytics platform powered by integrated open source technologies that help users glean actionable business insights from their data, wherever it lives. With an enterprise data cloud, it puts data management at analysts’ fingertips, with the scalability and elasticity to manage any workload. It offers users transparency into the whole data lifecycle and the flexibility of customization through its open architecture. It is available on an annual subscription basis with three offerings: CDP Data Center, Enterprise Data Hub and HDP Enterprise Plus. Each edition offers different components and pricing varies based on computing power, storage space and number of nodes. The company merged with Hortonworks in 2019 to provide a comprehensive, end-to-end hybrid and multi-cloud offering.

PRICE
$
$
$
$
$
DEPLOYMENT
COMPANY SIZE
S
M
L
PLATFORMS

Request with no obligation:

PRICEDEMO

MicroStrategy

User Sentiment:
User satisfaction level icon: great

MicroStrategy is a data analytics platform that delivers actionable intelligence to organizations of all sizes. It allows users to customize data visualizations and build personalized real-time dashboards. It leverages data connectivity, machine learning and mobile access to offer users comprehensive control over their insights. Due to its ease of use and scalability, it stands out as a leader in the enterprise analytics field. Users can choose between cloud, on-premise or hybrid deployment according to their needs.

PRICE
$
$
$
$
$
DEPLOYMENT
COMPANY SIZE
S
M
L
PLATFORMS

Request with no obligation:

PRICEDEMO

Logi Symphony

User Sentiment:
User satisfaction level icon: great

Logi Symphony (formerly Logi Analytics) provides businesses with interactive data analytics and visualizations, offering advanced reporting and visualization features in a minimal-code environment. It offers self-service data analysis and data discovery; then connects and blends operational intelligence to prepare it; and finally lets users turn it into dashboards, reports and other visualizations.

PRICE
$
$
$
$
$
DEPLOYMENT
COMPANY SIZE
S
M
L
PLATFORMS

Request with no obligation:

PRICEDEMO

Izenda

User Sentiment:
User satisfaction level icon: great

Izenda (replaced by Logi Symphony) is a business intelligence product that allows users to embed reporting and analytics capabilities into other applications. It monetizes data, promotes data literacy, offers insights and sets users up to make data-driven business decisions.From ad-hoc reports to ongoing insights, this software tool offers users a flexible range of data analysis features and visualization capabilities. It was designed for both developers and end users with a modern technology stack, flexible architecture and intuitive drag-and-drop interface.

PRICE
$
$
$
$
$
DEPLOYMENT
COMPANY SIZE
S
M
L
PLATFORMS

Request with no obligation:

PRICEDEMO

Power BI Embedded

User Sentiment:
User satisfaction level icon: great

Power BI Embedded is a platform-as-a-service (PaaS) that empowers enterprises and independent software vendors (ISVs) to embed fully interactive dashboards, reports and visualizations into their offerings. It is open and extensible, with fully documented, easy-to-use SDKs that facilitate embedding. Businesses can view up-to-date data with direct querying, scheduled refresh and streaming data connectivity. It enables self-service data analytics through its intuitive interface and easy navigation. A Pro license is necessary to publish to an embedded node.

PRICE
$
$
$
$
$
DEPLOYMENT
COMPANY SIZE
S
M
L
PLATFORMS

Request with no obligation:

PRICEDEMO

Qlik Sense

User Sentiment:
User satisfaction level icon: great

Qlik Sense is a self-service data analytics software that enhances human intuition with the power of artificial intelligence to enable better data-driven business decisions. It allows organizations to explore their data and create intuitive and compelling visualizations from data insights with drag-and-drop simplicity. As the next-generation advancement of QlikView, released in 2014, it expands analytical possibilities to support the entire insights life cycle and helps businesses modernize their approach to intelligence. It has two editions: Business and Enterprise, offered on a per account annual subscription. Enterprises can choose between a hosted SaaS public cloud or multi-cloud, on-premise or private cloud deployment. Qlik Sense Business comes with a free 30-day trial. Its desktop version is available for free for personal use.

PRICE
$
$
$
$
$
DEPLOYMENT
COMPANY SIZE
S
M
L
PLATFORMS

Request with no obligation:

PRICEDEMO

GoodData

User Sentiment:
User satisfaction level icon: great

GoodData is a powerful, embeddable, customizable SaaS solution that combines, analyzes and visualizes the internal and external data of an organization to help businesses change the way they make decisions, with a focus on data-driven best practices. It lets users process data, analyze trends and create visualizations that present information in an easily-digestible format. Users can interpret these visualizations to draw insights and make intelligent business decisions.

PRICE
$
$
$
$
$
DEPLOYMENT
COMPANY SIZE
S
M
L
PLATFORMS

Request with no obligation:

PRICEDEMO

Zoho Analytics

User Sentiment:
User satisfaction level icon: great

Zoho Analytics (formerly Zoho Reports) allows users to create visualizations and dashboards to present their data via a quick, easy, self-service model. It brings insight and analysis to an organization’s business data on-demand without needing IT assistance or data analysts through extensive automation efforts in several dimensions of the analytical process. Users can crunch huge datasets, clean and blend data, perform various analytical tasks and visualize the results in dynamic graphics to uncover insights. They can make data-informed business decisions in a stand-alone or embedded environment with support for mobile devices. It has flexible on-premise or cloud deployment models.

PRICE
$
$
$
$
$
DEPLOYMENT
COMPANY SIZE
S
M
L
PLATFORMS

Request with no obligation:

PRICEDEMO

ThoughtSpot

User Sentiment:
User satisfaction level icon: great

ThoughtSpot offers analytics and insight capabilities to industries seeking a deeper understanding of their proprietary data in order to make data-driven business decisions. It focuses on giving nontechnical users access to processing and analytics, bringing the ease of a search function to enterprise-scale data analysis. It offers a powerful search engine integrated with in-memory computing for a consumer-class UI.

PRICE
$
$
$
$
$
DEPLOYMENT
COMPANY SIZE
S
M
L
PLATFORMS

Request with no obligation:

PRICEDEMO

Sisense

User Sentiment:
User satisfaction level icon: great

Sisense is an end-to-end data analytics platform that makes data discovery and analytics accessible to customers and employees alike via an embeddable, scalable architecture. With a back-end powered by in-chip technology, it allows analysts to blend large datasets from a variety of sources into a single cohesive database for the entire company. On the front-end, users of all technical skill levels can craft visualizations, reports and dashboards to explore and share insights that drive businesses forward. Its AI-driven, cloud-native analytics offering, Fusion, embeds into business workspaces and empowers teams to view key metrics and data insights where they work. Designed for companies of all sizes, it can be deployed on-premises, as a private cloud-hosted SaaS, as a fully managed SaaS or via a hybrid strategy. It is available via annual subscription pricing and offered in three packages: its main offering BI Analytics Teams, its embedded analytics component Product Teams and code-driven cloud analytics through Cloud Data Teams.

PRICE
$
$
$
$
$
DEPLOYMENT
COMPANY SIZE
S
M
L
PLATFORMS

Request with no obligation:

PRICEDEMO

Infor Birst

User Sentiment:
User satisfaction level icon: great

Infor Birst is a cloud-based analytics software tool that aims to help users discover insights without the need for analyst input. It unifies IT-managed enterprise data with user-owned data, supporting the blending of both in a top-down and bottom-up manner. It uses consistent business metrics to structure raw data into organized sets and visualizations. It helps users identify patterns and better understand their organization’s KPIs. It offers a seamless, integrated UI that allows users to perform every step of the data analysis process in a single interface, enabling a smooth experience. It can be deployed either from the cloud or self-hosted on-premise. Users can purchase it in three available formats: per-user fee, by department or business unit or by end-customer in embedded scenarios.

PRICE
$
$
$
$
$
DEPLOYMENT
COMPANY SIZE
S
M
L
PLATFORMS

Request with no obligation:

PRICEDEMO

Jaspersoft

User Sentiment:
User satisfaction level icon: good

Jaspersoft is a reporting and data analytics suite built around the JasperReports engine that helps businesses create seamlessly embeddable, pixel-perfect reports, dashboards and visualizations. It empowers businesses with the self-service capabilities to find answers to data questions through beautifully rendered visuals that are easy to understand and explain. Bridging the gap between insight and action, it promotes ownership of the decision-making process across organizations. It includes JasperReports Library, JasperReports Server and JasperReports Studio. The vendor also offers a cloud and microservice-embeddable reporting engine, JasperReports IO.

PRICE
$
$
$
$
$
DEPLOYMENT
COMPANY SIZE
S
M
L
PLATFORMS

Request with no obligation:

PRICEDEMO

TARGIT

User Sentiment:
User satisfaction level icon: great

Targit is built from the ground up for reporting and business metrics, getting actionable insight from trillions of rows of data in seconds. It surfaces complex events and provides key information to make business decisions. It merges internal and external data and presents it in customizable dashboards and storyboards. Businesses can figure out how to grow in target markets by accurately analyzing data. Deployment options vary from stand-alone to embedded, with web browser compatibility built-in.

PRICE
$
$
$
$
$
DEPLOYMENT
COMPANY SIZE
S
M
L
PLATFORMS

Request with no obligation:

PRICEDEMO

Qrvey

User Sentiment:
User satisfaction level icon: excellent

Qrvey is an all-in-one embedded and distributed analytics platform purpose-built for SaaS providers living in the AWS ecosystem. It provides self-service visibility and control over entire data pipelines, including data collection and transformation, analytics and visualization. Working seamlessly with all types of structured, semi- and unstructured data, it helps organizations become more data-driven with a big picture approach to delivering insights and taking action. Compared to legacy, server-based environments, its modern, serverless architecture speeds and simplifies deployment while offering savings. It deploys directly into existing AWS environments, simplifying data security and compliance. Suitable for small, medium and large SaaS businesses alike, it prioritizes flexibility and scalability through its unique infrastructure. Special pricing is available for startups.

PRICE
$
$
$
$
$
DEPLOYMENT
COMPANY SIZE
S
M
L
PLATFORMS

Request with no obligation:

PRICEDEMO

Panintelligence

User Sentiment:
User satisfaction level icon: excellent

Panintelligence is a self-service, easy-to-use solution for company-wide reporting. It can display multiple data sources side by side, and the data shown is always live and up-to-date.It is easy to implement, cloud-based and offers multi-tenancy, load balancing, data mining and predictive analytics. Dashboards make it easy for anyone to visualize and communicate complex data in real time. It’s embeddable, highly customizable and reporting is streamlined. User activity can be restricted and audited, with role-based security.

PRICE
$
$
$
$
$
DEPLOYMENT
COMPANY SIZE
S
M
L
PLATFORMS

Request with no obligation:

PRICEDEMO
Call SelectHub for a free 15-minute selection analysis: 1-855-850-3850

Toucan

User Sentiment:
User satisfaction level icon: excellent

Toucan Guided Analytics (formerly branded as Toucan Toco) is a cloud-based platform consisting of two unified offerings that deliver data analytics and storytelling, as well as embedded analytics. Through data storytelling, it empowers businesses to explore their insights through visualizations and interactive dashboards. It centralizes information from disparate data sources and has a guided framework to help enterprises tell compelling stories with their data. Accessible to all, it encourages live collaboration throughout the analytics process to drive data-informed decision-making throughout an organization.In its embedded analytics form, it allows customers to extend these accessible and actionable insights to their clients through an intuitive front-end experience. Though it was built cloud-first, businesses can choose between the SaaS deployment via a private cloud, or an on-premise installation through Docker Image technology. It is suitable for small, medium and large businesses, and supports Windows, Mac and Linux.

PRICE
$
$
$
$
$
DEPLOYMENT
COMPANY SIZE
S
M
L
PLATFORMS

Request with no obligation:

PRICEDEMO

JReport

User Sentiment:
User satisfaction level icon: excellent

JReport by Logi Analytics (now discontinued) empowered companies to perform data analysis and generate reports directly from other business applications. It was scalable, customizable, fault-tolerant and worked seamlessly within other web interfaces. It integrated with any architecture and supported a range of embedding methods from the front and back ends.

PRICE
$
$
$
$
$
DEPLOYMENT
COMPANY SIZE
S
M
L
PLATFORMS

Request with no obligation:

PRICEDEMO

icCube

User Sentiment:
User satisfaction level icon: excellent

icCube is a Swiss embeddable analytics solution designed for B2B SaaS product and development teams to deeply embed analytic capabilities inside their applications. Its analytical dashboards blend into the end solution's UI and UX experience. An analytical engine lets users consume complex data models needing sophisticated security.It's a single Java process with definition files, allowing integration with any architecture. Companies can also package/containerize and deploy anywhere. Its dev2dev approach acknowledges each company's highly specific needs. icCube's dev team accompanies clients to successfully and quickly get into production.

PRICE
$
$
$
$
$
DEPLOYMENT
COMPANY SIZE
S
M
L
PLATFORMS

Request with no obligation:

PRICEDEMO

Board

User Sentiment:
User satisfaction level icon: great

Board is a robust solution that offers analytical insights, business analytics and enterprise performance management all under the same hood. It helps key players of a company improve the effectiveness of their decision making. Its customizable and interactive dashboards give enterprises the ability to see a high-level overview of their business, as well as drill down into their KPIs to assess business performance goals. It serves mid- to large-sized companies across various industries, and its programming-free toolkit helps businesses analyze and plan with a tailored, efficient approach, irrespective of technical skill levels.

PRICE
$
$
$
$
$
DEPLOYMENT
COMPANY SIZE
S
M
L
PLATFORMS

Request with no obligation:

PRICEDEMO

Dundas BI

User Sentiment:
User satisfaction level icon: great

Dundas BI is a browser-based analytics platform built to embed from the ground up. The vendor provides single and multi-tenant deployments with access to shared, reusable content. HTML5 enables customizable visualizations and user-friendly dashboards to build reports with interactivity options to drill down into data on demand. It allows secure write-backs to the database, capturing input through custom forms, stored procedures and REST APIs. It gives businesses complete control over the data stored on their IT infrastructure. The vendor offers a 25-day free trial.

PRICE
$
$
$
$
$
DEPLOYMENT
COMPANY SIZE
S
M
L
PLATFORMS

Request with no obligation:

PRICEDEMO

Reveal BI

User Sentiment:
User satisfaction level icon: great

Reveal is a purpose-built data analytics solution that empowers everyone within an organization with sophisticated insights they can use to make smarter business decisions. It allows users to connect to their data and create visualizations and interactive dashboards to monitor KPIs and trends in real-time. Through a self-service model, it encourages users to view, explore and share meaningful business insights and drive data-informed decision making. It is available for both on-premise and cloud-based SaaS deployment. It offers a seamless experience across web, Windows, iOS and Android. Pricing varies, with a fixed annual rate subscription model for embedded offerings and monthly to annual subscriptions billed on a per-user basis for individual licenses.

PRICE
$
$
$
$
$
DEPLOYMENT
COMPANY SIZE
S
M
L
PLATFORMS

Request with no obligation:

PRICEDEMO

Sisense For Product Teams

User Sentiment:
User satisfaction level icon: great

Sisense is an API-first fully customizable and white-labeled analytics platform that enables product teams to differentiate their products and improve customer satisfaction with embedded AI-powered insights and self-service data analysis. Product teams can drive customer value and deliver compelling and actionable insights when and where their customers need them, integrating with other apps or workflows for a seamless user experience.Built on a highly extendable, scalable and flexible cloud-native infrastructure, it can be integrated into any ecosystem and leveraged to build future-proof products that are secure and can scale without compromising performance or agility.

PRICE
$
$
$
$
$
DEPLOYMENT
COMPANY SIZE
S
M
L
PLATFORMS

Request with no obligation:

PRICEDEMO

WebFOCUS

User Sentiment:
User satisfaction level icon: great

WebFOCUS is a data analytics solution from Information Builders that helps businesses transform their data into actionable insights. Its intuitive interface makes self-service intelligence accessible to users of all skill levels. Its capabilities include dashboards, scorecards, mobile access, guided ad hoc reporting, data integrations, dynamic report distribution and much more. As of 2020, the vendor has announced that it will be acquired by TIBCO.

PRICE
$
$
$
$
$
DEPLOYMENT
COMPANY SIZE
S
M
L
PLATFORMS

Request with no obligation:

PRICEDEMO

Orbit Analytics

User Sentiment:
User satisfaction level icon: excellent

Orbit, which stands for Operational Reporting and Business Intelligence Technology, provides self-service advanced analytics to businesses for on-demand, data-driven decision-making. It pulls data from a wide range of sources, including Microsoft Excel, and enables high-performance data analysis through visualization and reporting. Connecting to more than 200 business applications, it ensures data integrity and security compliance across platforms.Leveraging R for statistical computing, it empowers businesses to make accurate and timely business decisions.

PRICE
$
$
$
$
$
DEPLOYMENT
COMPANY SIZE
S
M
L
PLATFORMS

Request with no obligation:

PRICEDEMO

Windward Reporting and Document Automation

User Sentiment:
User satisfaction level icon: excellent

Windward Studios offers an embeddable reporting/docgen tool built around designing templates in Microsoft Office. The combination of Office and Windward's tags make the reporting process quick and easy by removing the work of hand-coding reporting templates. It’s designed to produce beautiful reports in a number of different formats, including PDF, DOCX, XLSX, HTML, PPTX and more. After embedding the Windward .NET or Java engine, users can merge data with their templates to generate reports documents. This includes, but isn’t limited to, SQL Server, Oracle, DB2, MySql, PostgreSQL, XML, JSON, OData, and more. A template can use multiple datasources in a single template.

PRICE
$
$
$
$
$
DEPLOYMENT
COMPANY SIZE
S
M
L
PLATFORMS

Request with no obligation:

PRICEDEMO

AnswerRocket

User Sentiment:
User satisfaction level icon: excellent

AnswerRocket is an AI-powered augmented analytics tool that quickly provides the answers to questions decision makers ask, delivering actionable, accessible insights. It targets business users, enabling users of all technical skill levels to explore their data through natural language processing and an intuitive interface. Users can generate customizable interactive visualizations and dashboards from queries entered in plain English.

PRICE
$
$
$
$
$
DEPLOYMENT
COMPANY SIZE
S
M
L
PLATFORMS

Request with no obligation:

PRICEDEMO

Exago

User Sentiment:
User satisfaction level icon: excellent

Exago (replaced by Logi Symphony) is embeddable, flexible and scalable. It is designed for multi-tenant SaaS use and requires no additional desktop downloads or plug-ins. It offers an open API and customizable UI, giving users control and flexibility. It includes express reports, pixel-perfect reports, report formatting templates, crosstab reports, drill-down, a dashboard designer, maps, data blending and OLAP.

PRICE
$
$
$
$
$
DEPLOYMENT
COMPANY SIZE
S
M
L
PLATFORMS

Request with no obligation:

PRICEDEMO

Tableau

User Sentiment:
User satisfaction level icon: great

Tableau is a data visualization and analytics solution that assists enterprises in making data-driven business decisions. It blends information from a wide range of sources to deliver actionable, real-time insights. It allows exploration of data via intuitive means such as drag-and-drop filtering and natural language queries, irrespective of skill levels. With ample customization and security options, it offers control over data visualization, enabling creation of dashboards and stories that effectively convey business narratives. It can be purchased as part of the Tableau Creator package, which includes the desktop version, Prep and a Creator license of the server or online version.

PRICE
$
$
$
$
$
DEPLOYMENT
COMPANY SIZE
S
M
L
PLATFORMS

Request with no obligation:

PRICEDEMO

Power BI

User Sentiment:
User satisfaction level icon: great

Microsoft Power BI is an analytics tool that assists in reporting, data mining and data visualization to provide business insights. Through Power BI's simple interface, businesses can connect to a variety of data sources and create their own dashboards and reports. Originally born from Excel as an add-on, Power BI has since grown to stand on its own. At a relatively low cost, Power BI fulfills the needs of organizations ranging from small business owners to enterprise operators. There are three versions: Desktop, which is available for free for individual use, an upgraded Pro plan offered on a monthly price-per-user SaaS subscription and a capacity-based Premium plan which provides enterprise-level insights with on-premise deployment and a dedicated cloud infrastructure.

PRICE
$
$
$
$
$
DEPLOYMENT
COMPANY SIZE
S
M
L
PLATFORMS

Request with no obligation:

PRICEDEMO

Hortonworks

User Sentiment:
User satisfaction level icon: great

Hortonworks Data Platform is an open-source data analysis and collection product from Hortonworks. It is designed to meet the needs of small, medium and large enterprises that are trying to take advantage of big data. The company was acquired by Cloudera in 2019 for $5.2 billion. HDP has a number of features that help it process large enterprise-level volumes, including multi-workload processing, batch processing, real-time processing, governance and more.

PRICE
$
$
$
$
$
DEPLOYMENT
COMPANY SIZE
S
M
L
PLATFORMS

Request with no obligation:

PRICEDEMO

Domo

User Sentiment:
User satisfaction level icon: great

Domo is a cloud-based business management suite that accelerates digital transformation for businesses of all sizes. It performs both micro and macro-level analysis to provide teams with in-depth insight into their business metrics as well as solve problems smarter and faster. It presents these analyses in interactive visualizations to make patterns obvious to users, facilitating the discovery of actionable insights. Through shared key performance indicators, users can overcome team silos and work together across departments.

PRICE
$
$
$
$
$
DEPLOYMENT
COMPANY SIZE
S
M
L
PLATFORMS

Request with no obligation:

PRICEDEMO

Zoomdata

User Sentiment:
User satisfaction level icon: excellent

Zoomdata (now discontinued) was an analytics and reporting tool that allowed users to explore and analyze large, complex datasets. It provided a simple, modern interface that maked data literacy attainable for users of all technical levels.It was designed to be scalable and embeddable through white labeling architecture. It was built on HTML5 and JavaScript, making it fully customizable. It aimed to expedite the processes of data exploration, visualization and analysis to help users make data-driven decisions.

PRICE
$
$
$
$
$
DEPLOYMENT
COMPANY SIZE
S
M
L
PLATFORMS

Request with no obligation:

PRICEDEMO

Plotly Dash

User Sentiment:
User satisfaction level icon: excellent

Dash is an open-source Python library that helps data scientists create web interfaces to leverage Plotly’s data visualization and analytics applications. It provides an intuitive UI for people of all technical skills to use data science and machine learning for data analysis, thanks to components such as natural language processing for predictive modeling. It enables data analysts to translate business requirements directly into custom web development. MIT-licensed, it can easily run on local servers and machines. Its Enterprise version is available as a Platform-as-a-Service (PaaS) and can be easily deployed on proprietary infrastructure with SSO/LDAP authentication and app designing. The community version is available for free download, while the Enterprise version comes at a price and includes authentication features, server deployment and dedicated support.

PRICE
$
$
$
$
$
DEPLOYMENT
COMPANY SIZE
S
M
L
PLATFORMS

Request with no obligation:

PRICEDEMO

Yellowfin BI

User Sentiment:
User satisfaction level icon: great

Yellowfin BI is an integrated platform that helps users transform their business through data by combining automated data analysis, interactive dashboards and storytelling. It also enables intuitive filtering of large amounts of data in real time. It facilitates organization-wide understanding through data sharing and collaborative action. It has a customizable architecture and has the ability to add an organization’s branding, such as its logo. It offers either enterprise or embedded analytics and is deployable in the cloud or on-premise.

PRICE
$
$
$
$
$
DEPLOYMENT
COMPANY SIZE
S
M
L
PLATFORMS

Request with no obligation:

PRICEDEMO

Bold BI

User Sentiment:
User satisfaction level icon: excellent

Bold BI is an analytics platform with advanced embedded analytics. It consists of a web designer, viewer and widgets to perform operations without writing code. Leverage an interactive designer to build custom dashboards, pull metrics and visualize KPIs. Configure data connections and customize widget appearance with a drag-and-drop interface.

PRICE
$
$
$
$
$
DEPLOYMENT
COMPANY SIZE
S
M
L
PLATFORMS

Request with no obligation:

PRICEDEMO

Pricing & Cost Guide

See the Price/User for the top Embedded Analytics Tools… plus the most important considerations and questions to ask when shopping.

Real People... with Data

We know selecting software can be overwhelming. You have a lot on the line and we want you to make your project a success, avoiding the pitfalls we see far too often.

As you get started with us, whether it be with Software Requirements templates, Comparing, Shortlisting Vendors or obtaining that elusive Pricing you need; know that we are here for you.

Our Market Research Analysts will take calls, and in 10 minutes, take your basic requirements and recommend you a shortlist to start with.