Best Diagram Software

Diagram software is a computer program that enables users to create visual representations of information, ideas, and processes using various types of diagrams such as flowcharts, org charts, network diagrams, and more. It provides tools and templates to design, edit, and manipulate shapes, lines, and symbols to illustrate concepts and relationships.

Buyer's Guide

Last updated on November 6th, 2023
Diagram Software Is All About Communicating Data Visually

Diagram Software BG Intro

Interpreting the complex and often indecipherable output of business intelligence software without visuals can feel like trying to solve a puzzle with missing pieces.

Diagram software takes this information and presents it in visually digestible formats that support data communication. In this buyer’s guide, we’ll go over what these tools are, how they can help your business and how to pick the best solution.

Executive Summary

  • Diagram software helps businesses create informative visuals to help communicate critical points.
  • Key features include intelligent diagramming, real-time collaboration and integrations with existing systems.
  • Be sure to ask potential vendors any questions you have about the software before committing to a purchase.
What This Guide Covers:

What Is Diagram Software?

Diagram software is a tool that allows users to create charts, graphs and other visual diagrams to organize or communicate information. Team members can use these externally to advertise or communicate with customers or potential customers or internally to disseminate information to employees or organize tasks and action plans.

Primary Benefits

Diagram software offers a range of benefits for any business with project planning or data communication needs.

Diagram Software Benefits

Make Diagrams Quickly

Diagram tools offer a variety of templates for flowcharts and org charts, trend graphs, Venn diagrams and more. Import tools and integrations with other products mean that different data types can convert easily into diagrams for sharing in the desired format.

Boost Communication

Visual aids can convey complex information in simple, easily digestible formats. The best diagram software will create charts and graphics that are visually appealing to engage audiences and ensure that the information makes an impact.

Collaborate and Strategize

Diagrams don’t have to be static documents. Teams can work together to assemble and edit diagrams through live, real-time collaboration. They can also help to structure workflows and track project tasks and goals.

Key Features & Functionality

Here are the main features that diagram software offers:

Intelligent Diagramming

Generate diagrams from pre-built templates using simple commands, or start from scratch and create custom visuals. Drag and drop to rearrange and reorganize elements with automatic realignment.

Process Mapping and Task Management

Plan projects with visual maps and flowcharts to keep team members and stakeholders informed. Use diagrams to track and assign tasks and get a sense of project progress at a glance.

Integrations

Import data, images or existing diagrams from commonly used tools. Export created visuals to a variety of platforms like Microsoft, Google and Atlassian apps.

Live Collaboration and Presentation

Work together remotely in real time to edit diagrams and communicate through in-platform chat. Share with team members for dynamic presentations.

Security

Keep data private, protected and accessible by the right people. Maintain the integrity of diagrams and information by controlling who has viewing and editing permissions.

Software Comparison Strategy

With so many diagram solutions available with varying degrees of similarity in their capabilities, choosing the right one is daunting.

Start by considering your needs. Consult with the employees who will use the software and discover which features are most important to them. If you’re already using diagram software, consider its issues or shortcomings and consider what could fill those gaps.

It’s also important to research vendors thoroughly. You can check online reviews, read industry guides or check out our free requirements template to determine your desired features. Some vendors may offer a free trial so you can see how well the program fits your needs before committing to it.

Cost & Pricing Considerations

When comparing diagram software options, pricing may be affected by different factors. Many platforms offer free versions of their basic software with additional features available only in a paid version.

Purchase price generally depends on the scale at which the software will be used, with many vendors offering individual, team or enterprise-level plans. Choosing between cloud-based or on-premise deployment will also affect the price.

The Most Popular Diagram Software

To help you determine which diagram software best fits your needs, we’ve compiled some of the top contenders on the market. Check out our picks below:

Lucidchart

Lucidchart is cloud-based diagram software that creates flowcharts and other visuals and offers real-time collaboration and data sharing. It integrates with several popular workplace systems and can use imported data from a variety of sources. It also includes diagram templates with a library of shape and table assets.

Lucidchart

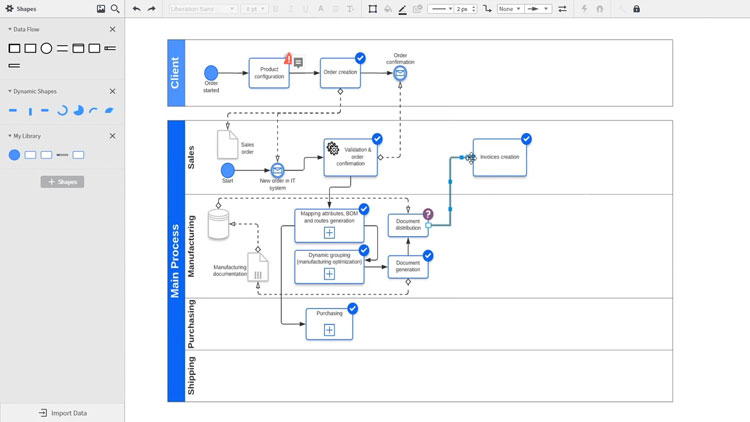
Process mapping and workflow visualization in Lucidchart. Source

Miro

Miro is a diagram creation tool that lets teams work together on dynamic visualizations and management systems. It includes additional collaboration tools like video chat and digital sticky notes to encourage participation. In addition to a range of templates, it offers a developer platform for deeper customization.

Miro

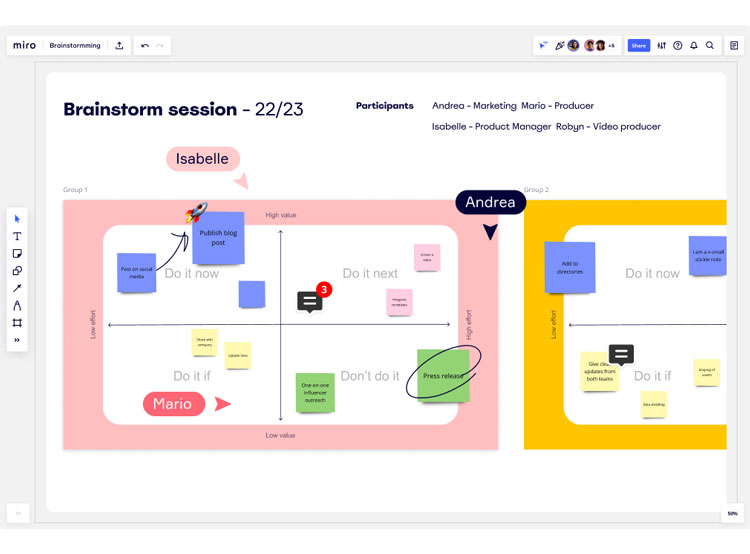
Miro’s real-time collaboration function. Source

SmartDraw

SmartDraw provides templates and automation tools to create diagrams quickly and easily. It offers intelligent formatting with automatic spacing and alignment and integrates with numerous apps and systems. It also works with file-sharing apps so anyone on your team can access and work on diagrams.

SmartDraw

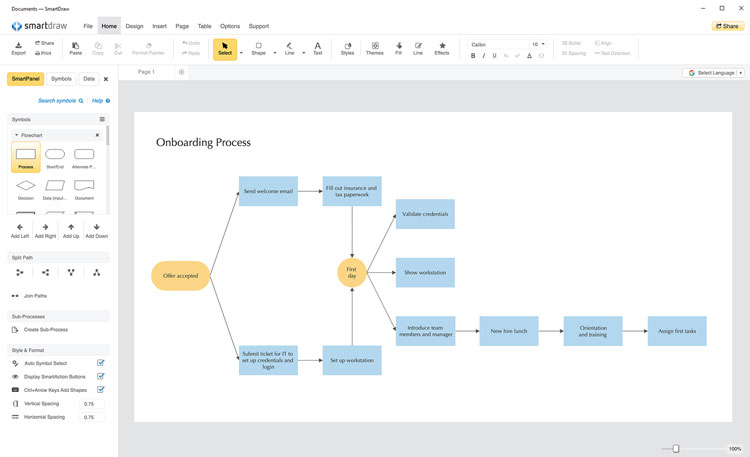
Branching flowchart in SmartDraw. Source


Questions To Ask

To get a better sense of your diagram software needs, ask yourself the following questions:

  • What are the internal and external use cases for this tool?
  • How many employees will use the software, and which ones?
  • What kind of installation and training processes will the software require?
  • What features does the software offer that we don’t currently have?
  • Which problems or pain points will it address?

Diagram Software Key Questions

Here are a few questions to ask potential vendors to learn more about them and determine whether their software is the right fit for you:

  • What type of companies and industries do you work with the most?
  • What kind of training or onboarding do you offer?
  • Do you offer ongoing technical support, and how does it work?
  • What privacy and security features does your software include?
  • How does your software integrate with other systems and applications?

Next Steps

Diagram software can take your company’s communication and coordination to the next level. There are a variety of different solutions on the market, with a wide range of features and functionalities available, so finding the right one is important.

Ready to take the next step in your product search? Get started today with our free comparison report to measure software leaders side by side.

Additional Resources

Tableau

User Sentiment:
User satisfaction level icon: great

Tableau is a data visualization and analytics solution that assists enterprises in making data-driven business decisions. It blends information from a wide range of sources to deliver actionable, real-time insights. It allows exploration of data via intuitive means such as drag-and-drop filtering and natural language queries, irrespective of skill levels. With ample customization and security options, it offers control over data visualization, enabling creation of dashboards and stories that effectively convey business narratives. It can be purchased as part of the Tableau Creator package, which includes the desktop version, Prep and a Creator license of the server or online version.

PRICE
$
$
$
$
$
DEPLOYMENT
COMPANY SIZE
S
M
L
PLATFORMS

Request with no obligation:

PRICEDEMO

Power BI

User Sentiment:
User satisfaction level icon: great

Microsoft Power BI is an analytics tool that assists in reporting, data mining and data visualization to provide business insights. Through Power BI's simple interface, businesses can connect to a variety of data sources and create their own dashboards and reports. Originally born from Excel as an add-on, Power BI has since grown to stand on its own. At a relatively low cost, Power BI fulfills the needs of organizations ranging from small business owners to enterprise operators. There are three versions: Desktop, which is available for free for individual use, an upgraded Pro plan offered on a monthly price-per-user SaaS subscription and a capacity-based Premium plan which provides enterprise-level insights with on-premise deployment and a dedicated cloud infrastructure.

PRICE
$
$
$
$
$
DEPLOYMENT
COMPANY SIZE
S
M
L
PLATFORMS

Request with no obligation:

PRICEDEMO

PowerPoint

User Sentiment:
User satisfaction level icon: great

PowerPoint is a rising application that ranks 7 among all Business Intelligence Tools according to our research analysts and 1356 crowd-sourced reviews from 2 sources. Starting from $6, PowerPoint is priced below average, commonly offers a free trial and is most fitting for all company sizes. Businesses who have used PowerPoint include ABB, CAT and Chevron. PowerPoint can be deployed online and on-premise and is accessible from a handful of platforms including Windows devices.

PRICE
$
$
$
$
$
DEPLOYMENT
COMPANY SIZE
S
M
L
PLATFORMS

Request with no obligation:

PRICEDEMO

Splunk

User Sentiment:
User satisfaction level icon: great

Splunk is an affordable analytics solution ideal for businesses of all sizes. It offers a number of common analytics features, including dashboards, plugins, automatic data enrichment, monitoring and alerts. It also provides unique features such as wide-sourcing of data, intel into different company functions and more. With cloud and on-premise deployment available, as well as a lightweight free version, it can serve a range of needs.

PRICE
$
$
$
$
$
DEPLOYMENT
COMPANY SIZE
S
M
L
PLATFORMS

Request with no obligation:

PRICEDEMO

Qlik Sense

User Sentiment:
User satisfaction level icon: great

Qlik Sense is a self-service data analytics software that enhances human intuition with the power of artificial intelligence to enable better data-driven business decisions. It allows organizations to explore their data and create intuitive and compelling visualizations from data insights with drag-and-drop simplicity. As the next-generation advancement of QlikView, released in 2014, it expands analytical possibilities to support the entire insights life cycle and helps businesses modernize their approach to intelligence. It has two editions: Business and Enterprise, offered on a per account annual subscription. Enterprises can choose between a hosted SaaS public cloud or multi-cloud, on-premise or private cloud deployment. Qlik Sense Business comes with a free 30-day trial. Its desktop version is available for free for personal use.

PRICE
$
$
$
$
$
DEPLOYMENT
COMPANY SIZE
S
M
L
PLATFORMS

Request with no obligation:

PRICEDEMO

Spark

User Sentiment:
User satisfaction level icon: great

Apache Spark is an open source unified analytics software for distributed, rapid processing. It distributes data across clusters in real time to produce market-leading speeds. It is rising in popularity in the space, catching up to its sister-offering, Hadoop, because of its quicker speeds and specific focus on optimizing processing performance and ability to stream data. It supports several coding languages, including Python, R, Scala, SQL and Java. It can function stand-alone, or be integrated into broader workflows easily.

PRICE
$
$
$
$
$
DEPLOYMENT
COMPANY SIZE
S
M
L
PLATFORMS

Request with no obligation:

PRICEDEMO

Datadog

User Sentiment:
User satisfaction level icon: great

Datadog is a comprehensive monitoring and analytics platform designed to empower businesses with real-time insights into their digital infrastructure. This product caters to a broad range of users, from DevOps teams to IT professionals, offering features like infrastructure monitoring, application performance tracking, and log management. Users appreciate Datadog's ability to provide end-to-end visibility, as one user mentions, "Datadog gives us a holistic view of our environment." It allows organizations to proactively identify and resolve issues, enhancing operational efficiency. However, some users note the pricing considerations, stating that "Datadog can get expensive as you scale." The cost can be a limitation for smaller businesses with limited budgets. In terms of performance, Datadog receives praise for its robust features, with users noting that it outperforms similar products. "Datadog is a game-changer," one user states. Overall, Datadog is well-suited for businesses seeking comprehensive monitoring and analytics, and it is seen as a top performer in its category, providing users with valuable insights and real-time monitoring capabilities.

PRICE
$
$
$
$
$
DEPLOYMENT
COMPANY SIZE
S
M
L
PLATFORMS

Request with no obligation:

PRICEDEMO

QlikView

User Sentiment:
User satisfaction level icon: great

QlikView is a data discovery and customer insight platform from Qlik, a leader in the insight and intelligence space. However, it is not available for purchase any longer. Qlik Sense, Qlik’s next-generation offering, is available for new customers. It offers self-service data that can help drive decisions and generate significant ROI for technical skill level users. It’s built from the ground up to be affordable, scalable and adaptable. It can ingest data from diverse sources like big data streams, file-based data, and on-premise or cloud data. It is well-known for its data associations and relationship functionality, keeping data in context automatically. It delivers results quickly via its patented in-memory data processing module, processing data down to as little as 10% of its original size.

PRICE
$
$
$
$
$
DEPLOYMENT
COMPANY SIZE
S
M
L
PLATFORMS

Request with no obligation:

PRICEDEMO

Spotfire

User Sentiment:
User satisfaction level icon: great

TIBCO Spotfire is a complete business intelligence and data discovery platform that can perform various functions, including in-depth analysis and robust visual reporting, all powered by artificial intelligence. It offers data streaming technology, which can support insights with AI, big data integration, integration with the Internet of things (IoT) and more.

PRICE
$
$
$
$
$
DEPLOYMENT
COMPANY SIZE
S
M
L
PLATFORMS

Request with no obligation:

PRICEDEMO

Oracle Analytics Cloud

User Sentiment:
User satisfaction level icon: great

Oracle Analytics Cloud is an AI-powered solution that provides robust reporting and analytics features to businesses of all sizes. It offers a strong selection of reporting and analytics features from the convenience of the cloud. It prepares and analyzes data for trends, then turns that data into an intuitive visualization for users to explore and share. This helps users get a deeper understanding of a range of business questions as well as make accurate predictions and forecasts.

PRICE
$
$
$
$
$
DEPLOYMENT
COMPANY SIZE
S
M
L
PLATFORMS

Request with no obligation:

PRICEDEMO

Semrush

User Sentiment:
User satisfaction level icon: excellent

Semrush is a leading platform that ranks 37 among all Marketing Automation Software according to our research analysts and 3767 crowd-sourced reviews from 2 sources. Starting from $119.95, Semrush is priced moderately, has offered a free trial in the past and is most advisable for any sized company. Semrush can be deployed in the cloud.

PRICE
$
$
$
$
$
DEPLOYMENT
COMPANY SIZE
S
M
L
PLATFORMS

Request with no obligation:

PRICEDEMO

Cognos Analytics

User Sentiment:
User satisfaction level icon: great

IBM Cognos Analytics is a self-service, web-based analytics platform which empowers users of all skill levels to explore data through reporting, data analytics, KPI monitoring, events and metrics. Reports give users the ability to not just visualize their insights, but also share them with colleagues. It integrates with Watson Analytics, which leverages IBM’s artificial intelligence and natural language processing to make insights more accessible to non-technical users. It has various components which give additional functionality, flexibility and agility when processing large sets of data.

PRICE
$
$
$
$
$
DEPLOYMENT
COMPANY SIZE
S
M
L
PLATFORMS

Request with no obligation:

PRICEDEMO

Black Knight

User Sentiment:
n/a

Black Knight offers an extensive suite of cloud-based solutions for businesses to improve decision-making through actionable data insights. It provides a unified end-to-end framework that combines its big data assets with data collection, visualization and analytics. Armed with multilingual support, machine learning techniques and an intuitive interface, it helps enterprises generate leads, adhere to compliance guidelines and increase process efficiencies.Though aimed at the mortgage and mortgage-related industry, it also offers data analytics to suit the needs of a range of other industries. Some of its industry-specific inclusions include hedge, enterprise, market and competitive analytics. Customers can opt for the origination, servicing or home equity collections, each focused on addressing specific challenges or utilize all three collections for expanded visibility.

PRICE
$
$
$
$
$
DEPLOYMENT
COMPANY SIZE
S
M
L
PLATFORMS

Request with no obligation:

PRICEDEMO

BusinessObjects

User Sentiment:
User satisfaction level icon: great

BusinessObjects from SAP offers a variety of packages to fit businesses of all industries and sizes. It aims to reduce the cost of IT upkeep and increase responsiveness to business problems. It streamlines workloads and lets users share insights to make better business decisions.

PRICE
$
$
$
$
$
DEPLOYMENT
COMPANY SIZE
S
M
L
PLATFORMS

Request with no obligation:

PRICEDEMO

MicroStrategy

User Sentiment:
User satisfaction level icon: great

MicroStrategy is a data analytics platform that delivers actionable intelligence to organizations of all sizes. It allows users to customize data visualizations and build personalized real-time dashboards. It leverages data connectivity, machine learning and mobile access to offer users comprehensive control over their insights. Due to its ease of use and scalability, it stands out as a leader in the enterprise analytics field. Users can choose between cloud, on-premise or hybrid deployment according to their needs.

PRICE
$
$
$
$
$
DEPLOYMENT
COMPANY SIZE
S
M
L
PLATFORMS

Request with no obligation:

PRICEDEMO

Mathematica

User Sentiment:
User satisfaction level icon: excellent

Wolfram Mathematica is a technical computing platform that can perform a wide range of computations and algorithms for mathematics and beyond. Primarily designed for research and academia, it enables users to create powerful scripts through a flexible, multi-purpose programming language. It allows users to analyze and visualize data in sophisticated ways and employ methods such as machine learning, data mining and deep learning to model and solve complicated problems. It is available in the cloud through any web browser or installable on-premises on all desktop environments. Users can purchase licenses as individuals or under group or enterprise pricing for cloud, desktop or both versions.

PRICE
$
$
$
$
$
DEPLOYMENT
COMPANY SIZE
S
M
L
PLATFORMS

Request with no obligation:

PRICEDEMO
Call SelectHub for a free 15-minute selection analysis: 1-855-850-3850

ThoughtSpot

User Sentiment:
User satisfaction level icon: great

ThoughtSpot offers analytics and insight capabilities to industries seeking a deeper understanding of their proprietary data in order to make data-driven business decisions. It focuses on giving nontechnical users access to processing and analytics, bringing the ease of a search function to enterprise-scale data analysis. It offers a powerful search engine integrated with in-memory computing for a consumer-class UI.

PRICE
$
$
$
$
$
DEPLOYMENT
COMPANY SIZE
S
M
L
PLATFORMS

Request with no obligation:

PRICEDEMO

Pentaho

User Sentiment:
User satisfaction level icon: great

Pentaho Business Analytics helps users gain insights to drive decisions and manage their data. Notable features include data visualization, dashboards, data modeling, reporting, role-based security, mobile access and a host of analytics capabilities. It serves customers of any size in all industries and can be delivered in the cloud or as an embedded implementation. It’s built on open-source principles to leverage existing data against future data and has enough to offer users of any skill level.

PRICE
$
$
$
$
$
DEPLOYMENT
COMPANY SIZE
S
M
L
PLATFORMS

Request with no obligation:

PRICEDEMO

Klipfolio

User Sentiment:
User satisfaction level icon: excellent

Klipfolio is an analytics software tool that helps users wield data intelligently and confidently by building dashboards and reports that track KPIs and monitor trends. Users can glean insights from information across the organization collected in one convenient place and deploy interactive data visualizations that they can share with ease. It is available through an annual or monthly subscription to one of four plans: Publish, Grow, Team and Team+. The number of dashboards and users allowed, as well as the data refresh rate and level of support varies depending on the pricing plan selected.

PRICE
$
$
$
$
$
DEPLOYMENT
COMPANY SIZE
S
M
L
PLATFORMS

Request with no obligation:

PRICEDEMO

RStudio

User Sentiment:
User satisfaction level icon: excellent

RStudio is an integrated development environment suite for the R programming language, synthesizing coding tools into one software tool for easier advanced data processing. Using in-memory processing, it is capable of parsing big data through integrations and connections. It is available in both open-source and commercial formats, with extra features available in the paid edition includes more sophisticated collaboration and security efforts. The free version is capable of end-to-end analytics, from API connectivity and data ingestion to visualization creation and distribution. It can be deployed standalone or on a web browser through connection to RStudio Server.

PRICE
$
$
$
$
$
DEPLOYMENT
COMPANY SIZE
S
M
L
PLATFORMS

Request with no obligation:

PRICEDEMO

Funnel

User Sentiment:
n/a

Integrate data from different platforms with the aid of connectors to facilitate robust analysis. Access real-time data to extract useful insights. Export data to multiple destinations for advanced analysis and visualization. Consolidating data at a centralized location ensures users gauge ROI across different marketing channels and campaigns. Understand KPIs with up-to-date dashboards and reports. Leverage standard rules to define naming conventions for dimensions and metrics.

PRICE
$
$
$
$
$
DEPLOYMENT
COMPANY SIZE
S
M
L
PLATFORMS

Request with no obligation:

PRICEDEMO

Infor Birst

User Sentiment:
User satisfaction level icon: great

Infor Birst is a cloud-based analytics software tool that aims to help users discover insights without the need for analyst input. It unifies IT-managed enterprise data with user-owned data, supporting the blending of both in a top-down and bottom-up manner. It uses consistent business metrics to structure raw data into organized sets and visualizations. It helps users identify patterns and better understand their organization’s KPIs. It offers a seamless, integrated UI that allows users to perform every step of the data analysis process in a single interface, enabling a smooth experience. It can be deployed either from the cloud or self-hosted on-premise. Users can purchase it in three available formats: per-user fee, by department or business unit or by end-customer in embedded scenarios.

PRICE
$
$
$
$
$
DEPLOYMENT
COMPANY SIZE
S
M
L
PLATFORMS

Request with no obligation:

PRICEDEMO

Zoho Analytics

User Sentiment:
User satisfaction level icon: great

Zoho Analytics (formerly Zoho Reports) allows users to create visualizations and dashboards to present their data via a quick, easy, self-service model. It brings insight and analysis to an organization’s business data on-demand without needing IT assistance or data analysts through extensive automation efforts in several dimensions of the analytical process. Users can crunch huge datasets, clean and blend data, perform various analytical tasks and visualize the results in dynamic graphics to uncover insights. They can make data-informed business decisions in a stand-alone or embedded environment with support for mobile devices. It has flexible on-premise or cloud deployment models.

PRICE
$
$
$
$
$
DEPLOYMENT
COMPANY SIZE
S
M
L
PLATFORMS

Request with no obligation:

PRICEDEMO

GoodData

User Sentiment:
User satisfaction level icon: great

GoodData is a powerful, embeddable, customizable SaaS solution that combines, analyzes and visualizes the internal and external data of an organization to help businesses change the way they make decisions, with a focus on data-driven best practices. It lets users process data, analyze trends and create visualizations that present information in an easily-digestible format. Users can interpret these visualizations to draw insights and make intelligent business decisions.

PRICE
$
$
$
$
$
DEPLOYMENT
COMPANY SIZE
S
M
L
PLATFORMS

Request with no obligation:

PRICEDEMO

PitchBook

User Sentiment:
User satisfaction level icon: great

PitchBook is a distinguished software product that ranks 55 among all Business Intelligence Tools according to our research analysts and 11 crowd-sourced reviews from 3 sources. Starting from $0, PitchBook is priced initially at no cost, offers a free trial on occasion and is most suitable for business of all sizes. Businesses who have used PitchBook include Deutsche Bank, Microsoft and Wells Fargo. PitchBook can be deployed online and on-premise and is accessible from a few platforms including Windows and Apple devices.

PRICE
$
$
$
$
$
DEPLOYMENT
COMPANY SIZE
S
M
L
PLATFORMS

Request with no obligation:

PRICEDEMO

ibi

User Sentiment:
User satisfaction level icon: great

Ibi by Information Builders offers cloud-based data and analytics platforms that empower users to turn their information into insights through robust visualization, reporting and data management. WebFOCUS is its primary offering. Flexible, configurable and scalable, it integrates data from many sources, simplifies data workflows and enables fast, easy organization and analysis of data. It allows users to make more confident data-driven decisions that drive business results.As of 2020, the vendor has announced that it will be acquired by TIBCO.

PRICE
$
$
$
$
$
DEPLOYMENT
COMPANY SIZE
S
M
L
PLATFORMS

Request with no obligation:

PRICEDEMO

Jaspersoft

User Sentiment:
User satisfaction level icon: good

Jaspersoft is a reporting and data analytics suite built around the JasperReports engine that helps businesses create seamlessly embeddable, pixel-perfect reports, dashboards and visualizations. It empowers businesses with the self-service capabilities to find answers to data questions through beautifully rendered visuals that are easy to understand and explain. Bridging the gap between insight and action, it promotes ownership of the decision-making process across organizations. It includes JasperReports Library, JasperReports Server and JasperReports Studio. The vendor also offers a cloud and microservice-embeddable reporting engine, JasperReports IO.

PRICE
$
$
$
$
$
DEPLOYMENT
COMPANY SIZE
S
M
L
PLATFORMS

Request with no obligation:

PRICEDEMO

SAS Visual Analytics

User Sentiment:
User satisfaction level icon: great

SAS Visual Analytics offers fast answers to complex questions drawn from datasets of all sizes. It provides guided exploration, interactive dashboards, smart visualizations and self-service analytics to users of all technical skill levels, promoting data literacy and visibility. Its versatile, scalable design helps users make better business decisions based on data transparency. Built on a cohesive in-memory architecture, it promotes intelligent action driven by insight.

PRICE
$
$
$
$
$
DEPLOYMENT
COMPANY SIZE
S
M
L
PLATFORMS

Request with no obligation:

PRICEDEMO

Minitab

User Sentiment:
n/a

Minitab is a statistics package that delivers statistical analysis, data visualizations and data analytics to help users improve data-driven decision making by streamlining their analytical workflow. It can analyze all kinds of datasets, from small to large, and automates statistical calculations and the creation of graphs, allowing users to focus more on data analysis. It enables users a range of customization options and has powerful scripting macro capabilities.It is currently available for on-premise installation on Windows or Mac operating systems only, with no SaaS or mobile options. Customers may choose between a single license for a stand-alone copy or an annual network license for multiple users, which includes upgrades to new versions. The company offers government and academic pricing options as well.

PRICE
$
$
$
$
$
DEPLOYMENT
COMPANY SIZE
S
M
L
PLATFORMS

Request with no obligation:

PRICEDEMO

FullStory

User Sentiment:
User satisfaction level icon: excellent

FullStory is a digital intelligence platform that provides comprehensive insights into users’ interactions with digital business experiences. It automatically detects issues that cause funnel drop, measures impacts, fixes bugs and finds solutions. Seamless communication through Slack and Jira links teams to the exact time and place where an issue occurs. It optimizes the client experience by allowing tracking and monitoring throughout the customer journey. It indexes entire sites and user interactions while spotting errors for the end-user.

PRICE
$
$
$
$
$
DEPLOYMENT
COMPANY SIZE
S
M
L
PLATFORMS

Request with no obligation:

PRICEDEMO

Izenda

User Sentiment:
User satisfaction level icon: great

Izenda (replaced by Logi Symphony) is a business intelligence product that allows users to embed reporting and analytics capabilities into other applications. It monetizes data, promotes data literacy, offers insights and sets users up to make data-driven business decisions.From ad-hoc reports to ongoing insights, this software tool offers users a flexible range of data analysis features and visualization capabilities. It was designed for both developers and end users with a modern technology stack, flexible architecture and intuitive drag-and-drop interface.

PRICE
$
$
$
$
$
DEPLOYMENT
COMPANY SIZE
S
M
L
PLATFORMS

Request with no obligation:

PRICEDEMO

Stata

User Sentiment:
User satisfaction level icon: great

Designed for data scientists, Stata is statistical software that helps users find insights through data exploration, visualization, modeling and analysis. It gives users a wide range of both standard and advanced statistical analyses that can help them make inferences and decisions based on data. With both a graphical user interface and command line structure, it’s accessible to users with or without coding knowledge. Users can choose between four offerings according to their needs: MP which is the fastest and largest version, SE for large datasets, IC for mid-sized data sets and Numerics for embedded. Suitable for companies of all sizes, it is available via on-premises installation on Windows, Mac and Linux/Unix devices, or via the SaaS model. Pricing varies based on the number and type of licenses requested, as well as the length of the subscription. It can be purchased for business, government, nonprofit, educational or student use and the vendor offers price quotes upon request.

PRICE
$
$
$
$
$
DEPLOYMENT
COMPANY SIZE
S
M
L
PLATFORMS

Request with no obligation:

PRICEDEMO

WebFOCUS

User Sentiment:
User satisfaction level icon: great

WebFOCUS is a data analytics solution from Information Builders that helps businesses transform their data into actionable insights. Its intuitive interface makes self-service intelligence accessible to users of all skill levels. Its capabilities include dashboards, scorecards, mobile access, guided ad hoc reporting, data integrations, dynamic report distribution and much more. As of 2020, the vendor has announced that it will be acquired by TIBCO.

PRICE
$
$
$
$
$
DEPLOYMENT
COMPANY SIZE
S
M
L
PLATFORMS

Request with no obligation:

PRICEDEMO

ClearStory Data

User Sentiment:
User satisfaction level icon: great

ClearStory Data was acquired by Alteryx in 2019. Data access and analysis were once relegated to specialists, quants or statisticians. Today, competitiveness on the front lines of business is dictated by the speed of data access and the quality of informed decision-making. ClearStory Data’s end-to-end solution includes an integrated Spark-based data processing platform and an incredibly simple user application for business consumption of insights.

PRICE
$
$
$
$
$
DEPLOYMENT
COMPANY SIZE
S
M
L
PLATFORMS

Request with no obligation:

PRICEDEMO

Datorama

User Sentiment:
User satisfaction level icon: great

Datorama helps businesses handle their processing and analysis needs for data sets of any size and complexity. It is scalable and cloud-based for growth, access and convenience. Powered by Salesforce, it’s built to provide enterprise-grade intelligence and insights.

PRICE
$
$
$
$
$
DEPLOYMENT
COMPANY SIZE
S
M
L
PLATFORMS

Request with no obligation:

PRICEDEMO

BIRT

User Sentiment:
User satisfaction level icon: great

It’s an open-source project on Eclipse and is an acronym for Business Intelligence and Reporting Tools. It lets organizations extract and transform data for business analysis. Its Report Designer enables visual report-building within interactive dashboards. The runtime component executes the reports once ready. Embedded into a range of business interfaces, it enables custom design layout, data access and scripting to present report output over the web. It supports charts, crosstabs, using multiple data sources within the same report, re-using queries within reports and addition of custom code.

PRICE
$
$
$
$
$
DEPLOYMENT
COMPANY SIZE
S
M
L
PLATFORMS

Request with no obligation:

PRICEDEMO

Real People... with Data

We know selecting software can be overwhelming. You have a lot on the line and we want you to make your project a success, avoiding the pitfalls we see far too often.

As you get started with us, whether it be with Software Requirements templates, Comparing, Shortlisting Vendors or obtaining that elusive Pricing you need; know that we are here for you.

Our Market Research Analysts will take calls, and in 10 minutes, take your basic requirements and recommend you a shortlist to start with.

Narrow Down Your Solution Options Easily

close

Applying filters...

Search by what Product or Type or Software are you looking for