Best Custom Reporting Software Tools

Custom reporting software tools are digital solutions designed to enable businesses to create tailored and personalized reports based on their specific requirements. These tools typically provide features for data extraction, report design, and report generation. Additionally, they may offer options for data filtering, visualization, and integration with various data sources. Custom reporting software tools empower businesses to generate reports that cater to their unique needs, improving data analysis, decision-making, and communication with stakeholders.

Buyer's Guide

Last updated on September 27th, 2023
Custom Reporting Tools Are All About Viewing Insights on Your Terms

Custom Reporting Software BG Intro

A one-size-fits-all approach to organizational reporting didn’t work in the Excel era and doesn't now. Enterprise reporting software provides companies and departments access to the latest domain-specific information. Custom reporting tools give you focused insight, letting you derive actionable information independently.

This buyer’s guide will assist your software search with handy resources and tips, including a brief description of the most popular custom report tools.

Executive Summary

  • Custom report software gives businesses access to dedicated metrics from various sources.
  • Live connectivity helps you stay informed about business performance and market trends.
  • Pre-built templates and interactivity for user autonomy are significant differentiators in custom reporting.
  • Omnichannel analytics, automation and embeddability are key features of report-generation platforms.
  • Ask the right questions internally and during vendor discussions to shortlist the best custom reporting solutions.
What This Guide Covers:

What Are Custom Reporting Tools?

Custom reporting tools are software solutions to create reports with the desired information in the required format. With these platforms, you can build marketing, point-of-sale (POS), customer relationship management (CRM), enterprise resource planning (ERP) and eCommerce reports. Additionally, enterprise reporting assists in inventory, supply chain and warehouse management.

These are BI, embedded analytics, big data and business analytics tools. Reporting is a standard feature of all BI tools, and the launch of various report generation tools gave it a distinct identity as a sub-category of business intelligence.

Google Analytics, pay-per-click (PPC), search engine optimization (SEO) and social media reports give you valuable marketing insight. Your human resources (HR) department needs reports on employees, such as recruitment, onboarding and offboarding metrics for performance management.

Enterprise accounting software enables building profit-and-loss reports, balance sheets and income statements. CRM custom reports include metrics on the sales funnel, forecasted sales, lead status, email outcomes, activity overview and profitability.

Report designers and editors are a standard attribute of such tools, letting you build the required reports and save them for the future. Additionally, pre-designed widgets give you a head start by connecting to your preferred sources within minutes.

Another differentiating feature of these tools is configuring scheduled report delivery. More on it in our Key Features section ahead.

Primary Benefits

Custom reporting tools help you stay ahead in the market, delivering timely, focused metrics to you and your stakeholders when needed. With interactive data exploration, you can stay informed with live updates and get answers to your queries.

Benefits of Custom Reporting Software

Stay Ahead of the Competition

With every business working with the same market data, what differentiates you is live information and how you act upon it. Real-time source connectivity and mobile insight give you 24/7 access to market trends and competitors’ performance metrics.

Using their outcomes as lessons can drive improvement in your business planning. Highlighting trends and patterns in reports aids in brainstorming to build winning strategies.

View the Complete Picture

Consolidated cross-department data gives you a complete view of your business’ performance. Converting this comprehensive information into custom reports saves effort in copy-pasting metrics from each platform separately.

An integrated workforce management report can clarify whether your company complies with labor targets. You can include all scheduled and open shifts by business unit and drill down to view the information by license type, role and start-end date.

Displaying daily, weekly and monthly work targets with color coding for compliance and non-compliance is easy to read and follow. As a supervisor, you can pull reports quickly and send reminders to employees short on their hours. You can learn which employees are nearing their weekly time limit and avoid assigning them weekend or on-call shifts.

Stay Informed

Embed entire dashboards, widgets or individual reports into your business applications.Live updates keep your analytics insights active wherever you embed them. It’s helpful in presentations and meetings for meaningful discussions and accurate decision-making.

With white labeling, you can place your brand logo, theme and colors in reports. Schedule daily, weekly or monthly report delivery to keep everyone informed about campaign status and business performance. Automatic report generation and scheduling streamline insight sharing by eliminating the risk of manual errors.

Get Focused Answers

You can keep critical KPIs first and foremost with custom reports. Answer the most complicated questions — view only the pertinent metrics and miss none with cross-platform integration. Expose the desired views — create high-level reports for top management and department-focused reports for individual teams.

You can save the custom views for future reference and share them with others. Draw attention to specific data points with highlighting, comments and annotations.

Key Features & Functionality

As part of software selection, you must create a requirements checklist with the must-have and nice-to-have features you want in the platform.

Source Connectivity

Built-in widget libraries, connectors and JAVA APIs enable connecting to relational and multidimensional databases, XML files, custom objects, online analytical processing (OLAP) cubes, websites and cloud-based tools.

You can import data from CSV, Google Sheets, SQL, private URLs and push APIs. The platform should connect to analytics software and other report-building solutions.

Omnichannel Analytics

Investing in omnichannel personalization can do wonders for your bottom line. Gathering and analyzing data from the channels your business uses will reap rich rewards for you in the long run.

You can derive customer analytics from email marketing campaigns, buyer journeys, POS sales and social media posts.

Check with potential vendors if their product provides omnichannel reports by integrating with customer data platforms, data analytics tools and ETL software.

Automated Reporting

Your preferred software should provide report templates for automatic insight sharing, which keeps everyone informed and helps avoid performance bottlenecks.

Besides scheduled sharing, trigger-based report delivery keeps recipients in the loop about unexpected KPI changes. Many software solutions offer report bursting — the capability to send focused reports to users by role.

Many data platforms have a scheduler to manage email notifications, report delivery, saving, printing and archiving. Administrators should be able to view all scheduled tasks on a centralized dashboard.

Embedded Analytics

Embedded reports are the need of the hour, with short sprints and fast shipping. Check with vendors if their product offers seamless embeddability into your preferred business systems.

White labeling gives a consistent in-app user experience, avoiding disruption and boosting productivity.

Interactive Reporting

The best custom reporting tools abstract SQL code while querying databases and sources. You can generate reports within minutes using an interactive toolkit and intuitive user actions, customizing them with style libraries, menus and drill-down options.

Report Archiving and Retrieval

You should have access to current and past reports. The software should enable checking progress, answering queries and tracking trends by comparing live reports with data from last week, month or previous year.

Software Comparison Strategy

Get a head start on your checklist with our requirements template pre-populated with standard custom report software features. Finalize your requirements after discussing them with stakeholders and convert them into questions. Distribute them to potential vendors with a request for proposal (RFP).

Review vendor proposals within your organization, ranking them on how well their product will likely address your business needs.

Refer to our Jumpstart platform for a complete breakdown of product scores and a feature-by-feature analysis of leading custom report-generation tools.

Cost & Pricing Considerations

Product cost can be a deal-breaker, so getting an estimate early in the process is an excellent idea. Check product prices on vendor websites, or contact them directly for quotes.

The value of a software product isn’t in its price — it’s how the platform serves your organization. Remember your unique needs, business size and domain requirements when assessing software.

Calculate the total cost of ownership (TCO) by factoring in additional user licenses, integrations and upgrades for when you’ll scale. Does it make sense to opt for a high-end product with built-in scalability today?

The Most Popular Custom Reporting Tools

Our analysts shortlisted the most popular custom reporting tools based on how well they address enterprise requirements. We discuss the top three here.

JasperReports

It’s an open-source Java-based report-building platform that generates embedded reports for analytics and BI systems, including websites. The JasperReports Library is its reporting engine and works with the JasperReports Server to provide advanced capabilities like report scheduling and automated delivery.

Jaspersoft Studio provides front-end data visualization and report generation for the JasperReports engine.

JasperReports

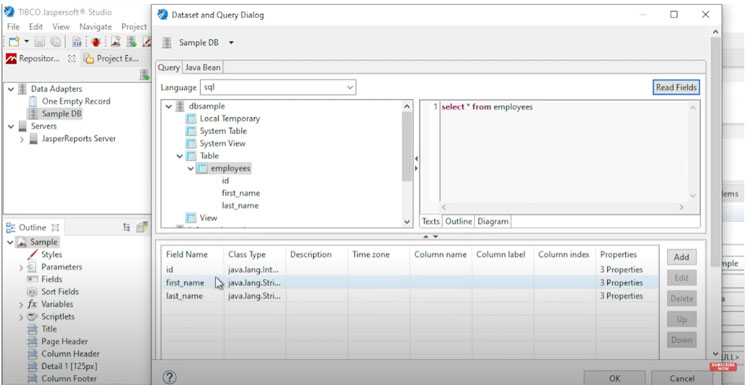
Design reports in Jaspersoft Studio with intuitive interface actions.

Crystal Reports

It’s a reporting tool from SAP that offers feature-rich data viewing options. You can host it locally, though it’s available as a SaaS model and integrates with other SAP and third-party offerings. Its semantic layer enables querying of large, complex datasets, letting you design print-ready reports on the fly.

IBM Watson

Create a custom report using the Design tab in Crystal Reports.

MicroStrategy

It’s a data analytics platform that provides custom reporting via machine learning and automated data discovery. It automatically provisions Intelligent Cubes in response to data queries, storing them in memory to reduce query overload on data repositories.

You can build and format reports as required and distribute them per schedule, limiting user access to pertinent data with role-based restrictions.

MicroStrategy

MicroStrategy Library allows you to create custom reports by defining filters via intuitive popups.


Questions To Ask

Before talking to vendors on your shortlist, ask these questions within your organization.

  • What do you hope to achieve with the custom reporting tool?
  • Who will use the software? What are their technical skills?
  • What’s the budget? How far are you willing to stretch it for a platform that fits?
  • Do you foresee business growth, and is scalability a must-have feature?
  • Do you need mobile reporting?

Custom Reporting Software Key Questions To Ask

Preliminary vendor discussions are valuable as they allow you to learn about the product and vendor. Discussing features, deployment options and the possible benefits to your business gives you clarity on whether they can meet your expectations.

  • Does the platform connect to your preferred sources?
  • Does it offer pre-built templates and a report designer for custom reporting?
  • What support and training do the vendors provide before, during and after implementation?
  • Is there a mobile app?
  • How often do they release updates?

To Wrap Up

Use this buyer’s guide while researching leading custom reporting tools. The resources and software selection tips included here should help you select a solution that fits.

Contact our Managed Selection Services to connect with buyers and walk you through the selection process.

JReport

User Sentiment:
User satisfaction level icon: excellent

JReport by Logi Analytics (now discontinued) empowered companies to perform data analysis and generate reports directly from other business applications. It was scalable, customizable, fault-tolerant and worked seamlessly within other web interfaces. It integrated with any architecture and supported a range of embedding methods from the front and back ends.

PRICE
$
$
$
$
$
DEPLOYMENT
COMPANY SIZE
S
M
L
PLATFORMS

Request with no obligation:

PRICEDEMO

Tableau

User Sentiment:
User satisfaction level icon: great

Tableau is a data visualization and analytics solution that assists enterprises in making data-driven business decisions. It blends information from a wide range of sources to deliver actionable, real-time insights. It allows exploration of data via intuitive means such as drag-and-drop filtering and natural language queries, irrespective of skill levels. With ample customization and security options, it offers control over data visualization, enabling creation of dashboards and stories that effectively convey business narratives. It can be purchased as part of the Tableau Creator package, which includes the desktop version, Prep and a Creator license of the server or online version.

PRICE
$
$
$
$
$
DEPLOYMENT
COMPANY SIZE
S
M
L
PLATFORMS

Request with no obligation:

PRICEDEMO

Power BI

User Sentiment:
User satisfaction level icon: great

Microsoft Power BI is an analytics tool that assists in reporting, data mining and data visualization to provide business insights. Through Power BI's simple interface, businesses can connect to a variety of data sources and create their own dashboards and reports. Originally born from Excel as an add-on, Power BI has since grown to stand on its own. At a relatively low cost, Power BI fulfills the needs of organizations ranging from small business owners to enterprise operators. There are three versions: Desktop, which is available for free for individual use, an upgraded Pro plan offered on a monthly price-per-user SaaS subscription and a capacity-based Premium plan which provides enterprise-level insights with on-premise deployment and a dedicated cloud infrastructure.

PRICE
$
$
$
$
$
DEPLOYMENT
COMPANY SIZE
S
M
L
PLATFORMS

Request with no obligation:

PRICEDEMO

BusinessObjects

User Sentiment:
User satisfaction level icon: great

BusinessObjects from SAP offers a variety of packages to fit businesses of all industries and sizes. It aims to reduce the cost of IT upkeep and increase responsiveness to business problems. It streamlines workloads and lets users share insights to make better business decisions.

PRICE
$
$
$
$
$
DEPLOYMENT
COMPANY SIZE
S
M
L
PLATFORMS

Request with no obligation:

PRICEDEMO

Domo

User Sentiment:
User satisfaction level icon: great

Domo is a cloud-based business management suite that accelerates digital transformation for businesses of all sizes. It performs both micro and macro-level analysis to provide teams with in-depth insight into their business metrics as well as solve problems smarter and faster. It presents these analyses in interactive visualizations to make patterns obvious to users, facilitating the discovery of actionable insights. Through shared key performance indicators, users can overcome team silos and work together across departments.

PRICE
$
$
$
$
$
DEPLOYMENT
COMPANY SIZE
S
M
L
PLATFORMS

Request with no obligation:

PRICEDEMO

Cognos Analytics

User Sentiment:
User satisfaction level icon: great

IBM Cognos Analytics is a self-service, web-based analytics platform which empowers users of all skill levels to explore data through reporting, data analytics, KPI monitoring, events and metrics. Reports give users the ability to not just visualize their insights, but also share them with colleagues. It integrates with Watson Analytics, which leverages IBM’s artificial intelligence and natural language processing to make insights more accessible to non-technical users. It has various components which give additional functionality, flexibility and agility when processing large sets of data.

PRICE
$
$
$
$
$
DEPLOYMENT
COMPANY SIZE
S
M
L
PLATFORMS

Request with no obligation:

PRICEDEMO

BIRT

User Sentiment:
User satisfaction level icon: great

It’s an open-source project on Eclipse and is an acronym for Business Intelligence and Reporting Tools. It lets organizations extract and transform data for business analysis. Its Report Designer enables visual report-building within interactive dashboards. The runtime component executes the reports once ready. Embedded into a range of business interfaces, it enables custom design layout, data access and scripting to present report output over the web. It supports charts, crosstabs, using multiple data sources within the same report, re-using queries within reports and addition of custom code.

PRICE
$
$
$
$
$
DEPLOYMENT
COMPANY SIZE
S
M
L
PLATFORMS

Request with no obligation:

PRICEDEMO

Oracle Reports

User Sentiment:
User satisfaction level icon: good

Oracle Reports is a component of the Oracle Fusion Middleware suite and offers businesses instant access to their data on all levels in a secure and scalable environment. The reports developer is a powerful WYSIWYG, or what-you-see-is-what-you-get, design tool that keeps report generation easy and intuitive.

PRICE
$
$
$
$
$
DEPLOYMENT
COMPANY SIZE
S
M
L
PLATFORMS

Request with no obligation:

PRICEDEMO

SSRS

User Sentiment:
User satisfaction level icon: great

The SSRS (SQL Server Reporting Service) platform from Microsoft allows users to create, share, deploy and manage reports for their business. The server-based system offers customization functions and lets users prepare and deliver various types of documents, both printed and interactive. This software can connect to SQL databases and utilize the Microsoft Visual Studio interface to explore and prepare data. It allows non-technical users access to report building and data exploration techniques that improve data literacy.

PRICE
$
$
$
$
$
DEPLOYMENT
COMPANY SIZE
S
M
L
PLATFORMS

Request with no obligation:

PRICEDEMO

JasperReports

User Sentiment:
User satisfaction level icon: great

JasperReports, at its core, is an embeddable, open-source Java-based reporting tool that can write to a variety of destinations. It can generate dynamic content suitable for embedded analytics. It includes the JasperReports Library, which is a reporting engine, and the JasperReports Server that provides advanced server capabilities, such as report scheduling and permissions-based access.Integrating into the larger Jaspersoft suite, to cater to businesses with sophisticated requirements, it supports front-end data visualization and reporting through Jaspersoft Studio.

PRICE
$
$
$
$
$
DEPLOYMENT
COMPANY SIZE
S
M
L
PLATFORMS

Request with no obligation:

PRICEDEMO

Funnel

User Sentiment:
n/a

Integrate data from different platforms with the aid of connectors to facilitate robust analysis. Access real-time data to extract useful insights. Export data to multiple destinations for advanced analysis and visualization. Consolidating data at a centralized location ensures users gauge ROI across different marketing channels and campaigns. Understand KPIs with up-to-date dashboards and reports. Leverage standard rules to define naming conventions for dimensions and metrics.

PRICE
$
$
$
$
$
DEPLOYMENT
COMPANY SIZE
S
M
L
PLATFORMS

Request with no obligation:

PRICEDEMO

Crystal Reports

User Sentiment:
User satisfaction level icon: great

SAP Crystal Reports is a feature-rich reporting tool that gleans business-critical insights through data exploration, visualization and custom reporting. Users drill-down to a high level of granularity to interact with and display data via visually rich reports and dashboards, enabling greater understanding of the metrics that count. Available as a SaaS model or hosted locally, it integrates with other SAP and third-party offerings, and third-party applications such as Microsoft Office to provide entry-level user access to data. Users leverage a universal semantic layer to query large data sets and to intuitively design ad-hoc and print-ready reports in a variety of export formats.

PRICE
$
$
$
$
$
DEPLOYMENT
COMPANY SIZE
S
M
L
PLATFORMS

Request with no obligation:

PRICEDEMO

MicroStrategy

User Sentiment:
User satisfaction level icon: great

MicroStrategy is a data analytics platform that delivers actionable intelligence to organizations of all sizes. It allows users to customize data visualizations and build personalized real-time dashboards. It leverages data connectivity, machine learning and mobile access to offer users comprehensive control over their insights. Due to its ease of use and scalability, it stands out as a leader in the enterprise analytics field. Users can choose between cloud, on-premise or hybrid deployment according to their needs.

PRICE
$
$
$
$
$
DEPLOYMENT
COMPANY SIZE
S
M
L
PLATFORMS

Request with no obligation:

PRICEDEMO

Microsoft Dynamics GP

User Sentiment:
User satisfaction level icon: good

Microsoft Dynamics GP is a versatile solution, well-suited for companies seeking to connect supply chain workflows with tasks such as financial management and human resources management. It offers a range of features, with the option to add on integrations with third-party offerings or implement advanced packages to further increase its functionality. It helps free up employee time to focus on other tasks through its automation of processes such as the generation of receivables, the creation of purchase orders and the direct deposit of employee pay to bank accounts. Available on-premise or in the cloud.

PRICE
$
$
$
$
$
DEPLOYMENT
COMPANY SIZE
S
M
L
PLATFORMS

Request with no obligation:

PRICEDEMO

InsightSquared

User Sentiment:
User satisfaction level icon: great

InsightSquared is a sales analytics SaaS platform that builds a path for revenue operations professionals from sales data to sales intelligence, empowering them to make better decisions informed by insights. It helps businesses dig deep into their sales pipelines to thoroughly understand what drives results. With AI-powered forecasting, detailed reporting, complete sales funnel visibility and employee performance tracking, it enables enterprises to track their key metrics and sales growth with precision and strategize for the future with confidence.Suitable for companies of all sizes, it simplifies the sales process and helps businesses improve ROI and maximize their results. As each offering is customized to fit the client’s needs, pricing and functionality will vary based on the tier of plan and number of components selected.

PRICE
$
$
$
$
$
DEPLOYMENT
COMPANY SIZE
S
M
L
PLATFORMS

Request with no obligation:

PRICEDEMO

GoodData

User Sentiment:
User satisfaction level icon: great

GoodData is a powerful, embeddable, customizable SaaS solution that combines, analyzes and visualizes the internal and external data of an organization to help businesses change the way they make decisions, with a focus on data-driven best practices. It lets users process data, analyze trends and create visualizations that present information in an easily-digestible format. Users can interpret these visualizations to draw insights and make intelligent business decisions.

PRICE
$
$
$
$
$
DEPLOYMENT
COMPANY SIZE
S
M
L
PLATFORMS

Request with no obligation:

PRICEDEMO

Planful

User Sentiment:
User satisfaction level icon: great

Formerly Host Analytics, Planful is a financial planning and analysis cloud platform. It accelerates end-to-end FP A. Suitable for midsize to large-scale businesses, it helps by centralizing data and managing financial and operational processes. It helps users plan and manage reviews, approvals and submissions and generates workflow status reports to check the performance of every department. It helps analyze asset performance by using financial budgeting and forecasting techniques with its capital planning feature. It is a scalable solution that allows companies to check the effect of projects on the overall bottom line.

PRICE
$
$
$
$
$
DEPLOYMENT
COMPANY SIZE
S
M
L
PLATFORMS

Request with no obligation:

PRICEDEMO

WebFOCUS

User Sentiment:
User satisfaction level icon: great

WebFOCUS is a data analytics solution from Information Builders that helps businesses transform their data into actionable insights. Its intuitive interface makes self-service intelligence accessible to users of all skill levels. Its capabilities include dashboards, scorecards, mobile access, guided ad hoc reporting, data integrations, dynamic report distribution and much more. As of 2020, the vendor has announced that it will be acquired by TIBCO.

PRICE
$
$
$
$
$
DEPLOYMENT
COMPANY SIZE
S
M
L
PLATFORMS

Request with no obligation:

PRICEDEMO

Jet Reports

User Sentiment:
User satisfaction level icon: great

Jet Reports offers easy-to-use reporting services designed to integrate with ERP platforms, especially Microsoft Dynamics. It addresses data warehousing, reporting and analytics needs, allowing users of all data literacy levels to perform data exploration tasks to generate reports and glean insights from their data.

PRICE
$
$
$
$
$
DEPLOYMENT
COMPANY SIZE
S
M
L
PLATFORMS

Request with no obligation:

PRICEDEMO

Infor Birst

User Sentiment:
User satisfaction level icon: great

Infor Birst is a cloud-based analytics software tool that aims to help users discover insights without the need for analyst input. It unifies IT-managed enterprise data with user-owned data, supporting the blending of both in a top-down and bottom-up manner. It uses consistent business metrics to structure raw data into organized sets and visualizations. It helps users identify patterns and better understand their organization’s KPIs. It offers a seamless, integrated UI that allows users to perform every step of the data analysis process in a single interface, enabling a smooth experience. It can be deployed either from the cloud or self-hosted on-premise. Users can purchase it in three available formats: per-user fee, by department or business unit or by end-customer in embedded scenarios.

PRICE
$
$
$
$
$
DEPLOYMENT
COMPANY SIZE
S
M
L
PLATFORMS

Request with no obligation:

PRICEDEMO

Logi Symphony

User Sentiment:
User satisfaction level icon: great

Logi Symphony (formerly Logi Analytics) provides businesses with interactive data analytics and visualizations, offering advanced reporting and visualization features in a minimal-code environment. It offers self-service data analysis and data discovery; then connects and blends operational intelligence to prepare it; and finally lets users turn it into dashboards, reports and other visualizations.

PRICE
$
$
$
$
$
DEPLOYMENT
COMPANY SIZE
S
M
L
PLATFORMS

Request with no obligation:

PRICEDEMO

ActiveReports

User Sentiment:
User satisfaction level icon: poor

ActiveReports is a .NET reporting tool from GrapeCity that facilitates the creation of reports to display proprietary data in the form of documents or web-based formats. It is based on C# code and uses the Visual Studio interface, offering easy use by programmers. This reporting solution comes in a standard and professional edition and only operates on the Windows platform. It lets users export reports into a range of formats for collaboration and presentation.

PRICE
$
$
$
$
$
DEPLOYMENT
COMPANY SIZE
S
M
L
PLATFORMS

Request with no obligation:

PRICEDEMO

ReportsNow

User Sentiment:
User satisfaction level icon: excellent

ReportsNow is a JD Edwards reporting solution that helps in real-time reporting of proprietary data for analysis. Pulling data from and integrating with JDE as well as non-JDE sources, it provides a host of intuitive functions to help create a wide range of business reports, allowing for automated scheduling and downloading of these reports. Through advanced reporting via Data Access Studio, enterprises can create and edit any kind of data. Its mobile BI stack enables cloud connectivity, making reports available on any device.

PRICE
$
$
$
$
$
DEPLOYMENT
COMPANY SIZE
S
M
L
PLATFORMS

Request with no obligation:

PRICEDEMO

Stimulsoft Reports

User Sentiment:
User satisfaction level icon: excellent

Stimulsoft Reports is a suite of report and dashboard products in Java, PHP, .NET and other formats. It allows for enhanced development of multi-tier reports and interactive dashboards through an intuitive designer that can draw from internal and relational sources.It can be packaged or purchased individually depending on the user’s needs. It can be scaled through Stimulsoft Server to enable further functions like analytics and processing. It is deployable via the web or on Linux, Mac or Windows.

PRICE
$
$
$
$
$
DEPLOYMENT
COMPANY SIZE
S
M
L
PLATFORMS

Request with no obligation:

PRICEDEMO

Panintelligence

User Sentiment:
User satisfaction level icon: excellent

Panintelligence is a self-service, easy-to-use solution for company-wide reporting. It can display multiple data sources side by side, and the data shown is always live and up-to-date.It is easy to implement, cloud-based and offers multi-tenancy, load balancing, data mining and predictive analytics. Dashboards make it easy for anyone to visualize and communicate complex data in real time. It’s embeddable, highly customizable and reporting is streamlined. User activity can be restricted and audited, with role-based security.

PRICE
$
$
$
$
$
DEPLOYMENT
COMPANY SIZE
S
M
L
PLATFORMS

Request with no obligation:

PRICEDEMO

i-net Clear Reports

User Sentiment:
n/a

I-net Clear Reports is a Java-based enterprise reporting solution. With its free template designer and access to a template repository, it streamlines the process of compiling data into a presentable form. It is compatible with anything that can run Java and can pull from any Java Database Connectivity data source. It can be embedded or executed stand-alone in a browser. It can export files in a variety of formats, including PDF, SVG, XML and JPEG.

PRICE
$
$
$
$
$
DEPLOYMENT
COMPANY SIZE
S
M
L
PLATFORMS

Request with no obligation:

PRICEDEMO

Windward Reporting and Document Automation

User Sentiment:
User satisfaction level icon: excellent

Windward Studios offers an embeddable reporting/docgen tool built around designing templates in Microsoft Office. The combination of Office and Windward's tags make the reporting process quick and easy by removing the work of hand-coding reporting templates. It’s designed to produce beautiful reports in a number of different formats, including PDF, DOCX, XLSX, HTML, PPTX and more. After embedding the Windward .NET or Java engine, users can merge data with their templates to generate reports documents. This includes, but isn’t limited to, SQL Server, Oracle, DB2, MySql, PostgreSQL, XML, JSON, OData, and more. A template can use multiple datasources in a single template.

PRICE
$
$
$
$
$
DEPLOYMENT
COMPANY SIZE
S
M
L
PLATFORMS

Request with no obligation:

PRICEDEMO

SlamData

User Sentiment:
n/a

SlamData is an open source tool based on SQL that aims to make it easy for developers and non-developers to access MongoDB. This software is one of the fastest growing products in the NoSQL database space. This program brings high-quality source integration to the table, meaning that users can import from any source; no coding skills needed. This data can then be streamed to a variety of sources.

PRICE
$
$
$
$
$
DEPLOYMENT
COMPANY SIZE
S
M
L
PLATFORMS

Request with no obligation:

PRICEDEMO

Upper Quadrant

User Sentiment:
n/a

Upper Quadrant is an analytics and data science platform that facilitates marketing automation, campaign management, budgeting and forecasting. Used specifically by race organizers for event registrations, subscriber outreach and eCommerce, it aggregates and standardizes data from people, brands, geographical locations, business units and disparate systems. It enables data management and performance metrics tracking through real-time dashboards and shareable reports. Race organizers can share run metrics with customers through automated emails delivered straight to their inboxes.

PRICE
$
$
$
$
$
DEPLOYMENT
COMPANY SIZE
S
M
L
PLATFORMS

Request with no obligation:

PRICEDEMO

Real People... with Data

We know selecting software can be overwhelming. You have a lot on the line and we want you to make your project a success, avoiding the pitfalls we see far too often.

As you get started with us, whether it be with Software Requirements templates, Comparing, Shortlisting Vendors or obtaining that elusive Pricing you need; know that we are here for you.

Our Market Research Analysts will take calls, and in 10 minutes, take your basic requirements and recommend you a shortlist to start with.

Narrow Down Your Solution Options Easily

close

Applying filters...

Search by what Product or Type or Software are you looking for