You released a new product in select stores, and footfall increased. That’s great news, right? But, hold on, your statistical software solution tells you the same stores have more female employees.
Could that be the actual reason for more people visiting? Statistical software solutions are business intelligence tools that help you connect the dots. Including employee gender, in this case, gives you insight not visible at first glance.


This article discusses the best statistical analytics tools and answers common queries.
Statistical analysis software platforms are tools that rely on mathematical calculations and statistics theorems to analyze data.
Researchers, data scientists and analysts may use statistical analysis to:
- Investigate and present information from data sets.
- Explore the relationships between data points.
- Identify underlying trends and patterns.
- Generate and prove or disprove the validity of probability models.
- Use software algorithms for predictive analytics.
- Uncover actionable insight.
Best Statistical Software
Our analysts curated a list of the best statistics software in the market after diligent research. Here’s a look at the top five.

IBM SPSS Statistics
SPSS (Statistical Package for the Social Sciences) is statistical analysis software supporting social science research using statistical techniques. These include descriptive analytics for advanced predictions using scenario simulations.
Additionally, you can add location coordinates to your analyses.

Analyze time-to-event data with accelerated failure time (AFT) models. Source
Top Benefits
- Leave No Data Behind: Read and write data from ASCII text files, spreadsheets, Microsoft Excel, Access and other databases, including other statistical platforms.
- Prepare Data: Clean up large datasets by automatically identifying missing or invalid values. Perform accurate analysis with its data conditioning workflows.
- Make Predictions: Uncover correlations using time-series analysis, temporal causal modeling and neural networks. The tool accounts for future uncertainty with probability distributions and improve predictive models iteratively.
- Use Easily: Filter, aggregate and sort metrics as desired with no-code, point-and-click and drag-and-drop actions. Get answers using natural language queries.
Primary Features
- Open-Source Integration: Enhance SPSS syntax using R and Python with the IBM Extension Hub, or build custom code to automate statistical procedures.
- Functions Library: Besides linear, nonlinear and simulation modeling, techniques include Bayesian statistics, custom tables, complex sampling, advanced statistics and regression.
- Multiple Export Formats: Export data to your native application’s file format or standard formats like text, Microsoft Word, PDF, Excel, HTML and XML.
Limitations
- The vendor doesn’t offer free add-ons with the student module.
- Lacks high-quality, customizable graphics.
- Doesn’t provide backward compatibility for output files with extensions .spo and .spv.
Platform:
Company Size Suitability: S M L
SAS/STAT
It’s cloud-based statistics software for data analysis. Multithreaded procedures speed up processing, letting business analysts, data scientists, researchers and engineers observe and analyze data trends and patterns.
The open-source platform lets you play around with the interface and create code in the language of your choice.
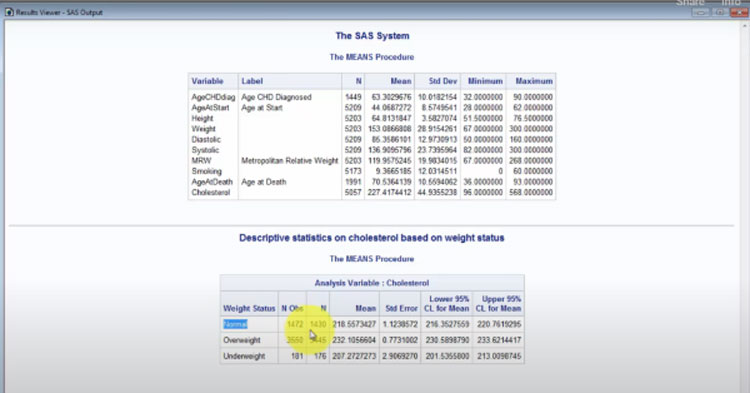
Comparing cholesterol levels against patient weight using descriptive statistics. Source
Top Benefits
- Make Informed Decisions: Close gaps in the data-to-decision life cycle with seamless information access and data quality management. The tool offers enhanced functionality by integrating with Hadoop.
- Analyze Data: SAS/STAT intelligently analyzes small and large datasets with high-performance statistical modeling. It helps fill in missing values with modern analytics methods.
- Get Support: SAS offers free e-learning courses, how-to videos and online documentation to help you start with STAT. Find answers and resolve issues by reaching out to online communities.
Primary Features
- Statistical Analysis: The tool enables the creation of linear and nonlinear, Bayesian, accelerated failure time, Cox regression, nested and finite mixture models.
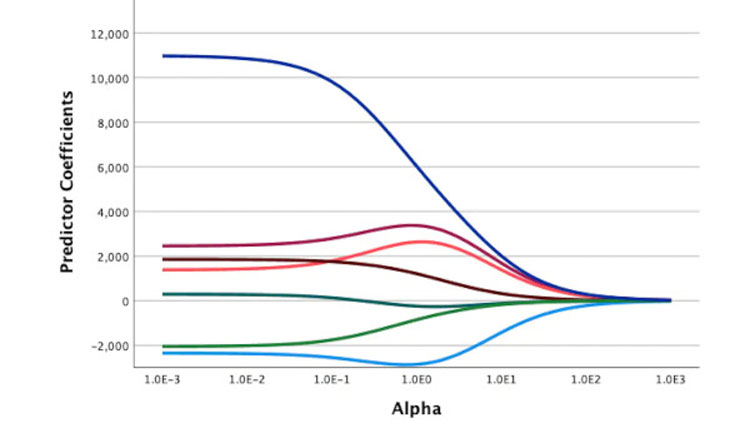
- Predictive Modeling: SAS/STAT supports forecasting with least squares and regression modeling. You can perform distribution, categorical, psychometric and spatial analysis, in addition to analysis of variance.
- SAS Integrations: Its Metadata Server lets you integrate data models into other SAS offerings — Analytics Pro, University Edition, and In-Memory and Visual Statistics.
Limitations
- Doesn’t provide extensive graphical capabilities.
- It isn’t intuitive. You need prior knowledge of statistical procedures.
Platform:
Company Size Suitability: S M L
Stata
It’s statistical analysis software for behavioral research, finance, business and marketing analysis. A graphical user interface and command-line structure make the software accessible to all users, irrespective of technical skills.
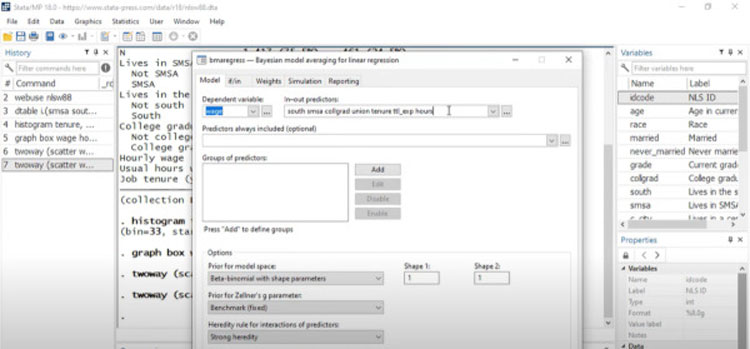
Linear regression analysis in Stata. Source
Top Benefits
- Get a Fit-To-Size Version: Stata is available in four flavors.
- Stata/MP: its fastest and largest version
- Stata/SE: for large datasets
- Stata/IC: for mid-sized datasets
- Numerics: for embedded and web applications
- Prepare for the Future: Get ready for future opportunities and mitigate risks. Conduct experiments and manipulate predictor variables through regression.
- Work With Any Version: Stata allows older scripts and programs to continue working in modern editions — no need to maintain multiple platform installations.
- Import/Export Data: Move data in and out of the platform in XLS, CSV, spreadsheet, ASCII files and text formats. Stata can import files from other statistical analytics tools, including SAS and SPSS products.
- Obtain Support: Access to video resources, blogs and webinars on Stata’s Youtube channel and sign up for vendor-provided NetCourses online. Registered users get free technical support.
Primary Features
- Advanced Programming: Incorporate C, C++ and Java plug-ins via a native API. Integration with Python lets you embed and execute coding directly within the program.
- Automated Reporting: Set up automatic report generation in Word, Excel, PDF and HTML formats. Customize the look and feel of the reports as desired.
- Statistical Functions: The solution offers linear, finite mixture, spatial autoregressive models, among others.
- Quality Graphics: Generate pie, dot and bar charts, histograms, and box, scatter and spike plots. You can export graphics in EPS, TIFF, PNG, SVG and PDF formats.
Limitations
- Doesn’t offer a competitive advantage over Python and R.
Platform:
Company Size Suitability: S M L
Minitab
It’s a statistics platform supporting business analytics for forecasting, product development and improving operations. R and Python integrations support t-tests, two proportion, chi-square, normality and equivalence tests.
Its predictive analytics module includes classification and regression trees (CART), random forests and TreeNet, exclusive to Minitab.
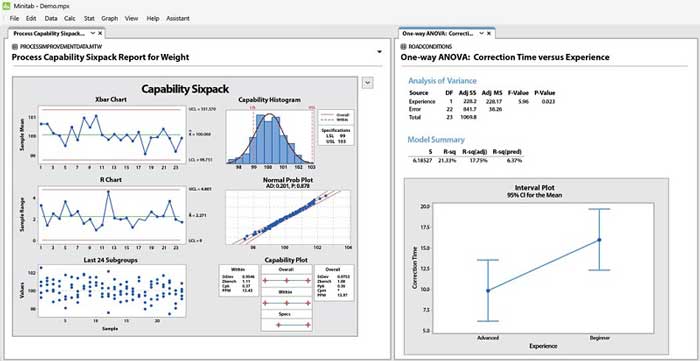
One-way analysis of variance (ANOVA) in Minitab. Source
Top Benefits
- Prepare Data: Take the grunt work out of data prep — sort through and transpose your data with a seamless, one-click import process.
- Get Deep Insight: Glance into the future with logistic regression, time-series, factor and cluster analysis.
- Gain Resources: A free Quick Start resource introduces you to the platform’s essential functions. The vendor sells animated lessons and hands-on exercises as part of Quality Trainer e-Learning courses.
Primary Features
- Graphics: Display your findings through scatter, matrix, box, time series and probability plots and share them with others as Microsoft Word, Powerpoint, TIFF, JPEG, PNG, BMP, GIF and EMF files.
- Analytics Functions: Identify distributions, correlations, outliers, and missing values with the analysis of variance, regression, experiment design, variables control charts and survival/reliability analysis.
- Guided Insight: Interpret results with step-by-step guidelines, including definitions and illustrated examples. An interactive decision tree lets you pick the desired statistical analysis.
Limitations
- It isn’t available as a software-as-a-service (SaaS) or mobile app.
Platform:
Company Size Suitability: S M L
GraphPad Prism
It’s a statistics and data analysis solution aiding in scientific research. Life sciences, biotechnology, healthcare, pharmaceuticals, automotive, technology and telecom industries use it to streamline operations and grow their business.
The vendor offers free and paid scientist-taught online courses through their Prism Academy.
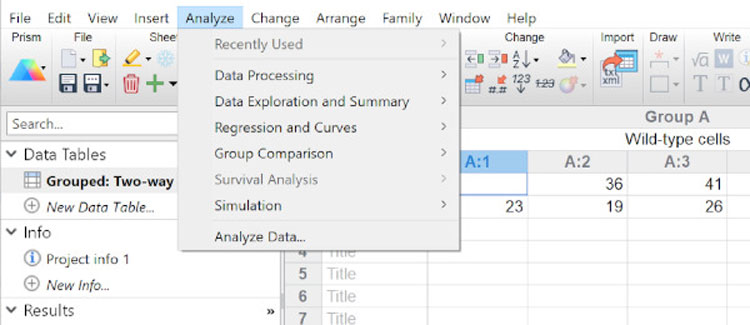
The solution has a special Analyze menu in the toolbar. Source
Top Benefits
- Perform Different Analyses: Prism offers a rich statistical functions library to perform t-tests, nonparametric comparisons, and regression and survival analysis.
- Get Live Insight: Update results with live data changes — linked graphs update in sync.
- Collaborate: Work better together — the platform allows storing project information in one shareable file where everyone can add insight.
Primary Features
- Automation: Save time by setting up reproducible workflows.
- Customizable Graphics: Personalize as desired — choose the graph type, layout, style, labels, colors and fonts. Export graphs in publication-quality formats and customize the resolution, transparency and dimensions.
- Vendor Assistance: Go through vendor help guides and tutorials for hands-on practice creating charts and sample datasets.
Limitations
- It isn’t available on Linux.
- It isn’t available as a cloud-based platform.
- Doesn’t provide tools to write equations on a graph or a layout.
The above discussion isn’t the final word on the best statistical platform for your business. It merely indicates the features and benefits you can expect when buying a software solution.
Platform:
Company Size Suitability: S M L
Considerations
It’s easy to get impressed by shiny, new features and extensive functions libraries. Keeping your business needs front and center can help you shortlist suitable platforms for approval by senior stakeholders.
Ask the following questions internally before starting your software search.
What Kind of Data Needs Analyzing?
Statistical analysis platforms are advanced tools that work best with large, complex datasets. Using them for simple data analysis is impractical since you’ll likely use only a tiny percentage of their functions.
Who Will Use the Tool?
Are your users experts, amateurs or somewhere in between? Statistical analysis isn’t easy — many such platforms can confuse the average user and have a higher learning curve.
Determine your users’ level of experience with statistics. Expert data scientists will feel at home crunching numbers with equations and programming languages.
Novice users may feel overwhelmed with a mathematical format and prefer using a familiar, menu-based interface.
Do you need a robust platform with powerful coding capabilities or a tool to display basic statistical models?
How Will It Integrate With Existing Solutions?
Interoperability and integration are must-haves in any platform. Many statistical tools are built from the ground up to integrate with existing databases, file formats and business frameworks.
A statistical analysis program is a component of your tech stack, and all parts need to work together. Will your preferred solution play well with others?
Add it to your list of questions to ask during vendor discussions.
What Graphics Quality Do You Need?
Some platforms have several data visualization options, while others generate bare-bones graphics with less customization.
Visualizations enable easier data interpretation. Source
Do you prefer interactive or static visualizations? Will you need ad hoc reporting and visualization? Will it let you export visualizations to other platforms?
What’s Your Budget?
Statistical analytics tools like Python and R are open-source and free, while advanced offerings can cost thousands of dollars per license.
Will you need just one license or several? Many vendors offer discounted academic versions to students, teachers and universities, and it might be worth checking them out if you represent an educational institution. IBM SPSS is an example.
Are Documentation and Support Available?
There’s nothing more frustrating than a solution creating more problems than it solves. It’s easier to use programs with comprehensive documentation than those where you must figure it out independently.
Before choosing a solution, ask if it comes with documentation your users can understand. At the very least, they should have access to technical support should they have questions.
FAQs
What are the benefits of statistical analysis?
Statistics might seem daunting to non-technical users, but the right BI tools can make it straightforward. It helps you base decisions on facts rather than guesses or experience.
- Statistical analysis enables accurate mathematical calculations against complex datasets, supporting performance tracking, market research and product development.
- Accurate calculations help separate correlation and cause, establishing data dependencies and relationships.
- Relying on software for research interpretation avoids sampling errors and ensures correct data and unbiased results.
- Visualization and interactivity with the freedom to customize how you view and present information enable easier data interpretation.
What are the various statistical analysis techniques?
Research objectives and data types, volumes and complexity determine the analytics techniques for a study.
- Descriptive statistics involves summarizing the primary features of datasets. These include mean, median, mode, variance and standard deviation.
- Inferential statistics uses sample demographics to make inferences about a population. Hypothesis testing, confidence intervals and regression analysis are examples.
- Hypothesis testing involves verifying a claim’s validity by determining if there’s enough supporting evidence.
- Regression analysis helps forecast the value of dependent variables based on changes in independent variables.
- ANOVA (Analysis of Variance) involves analyzing how two groups differ by comparing their mean values.
- The Chi-Square testing technique associates variables by comparing their observed and expected values.
- Factor analysis evaluates the determining factors that explain the correlations between variables.
- Cluster analysis helps identify patterns within data by grouping datasets into groups or clusters.
- Time series analysis supports forecasting by examining patterns and trends in data over time.
Are SAS and SPSS similar?
No. Although both solutions offer several statistical techniques and data manipulation attributes, they also have limitations.
| SAS | IBM SPSS | |
|---|---|---|
| Functionality | It’s versatile and offers a broader range of statistical and advanced analytics methods. | Its statistical methods focus on social science-based research areas. |
| Programming Language | The vendor offers a native programming language for data analysis. | The tool provides a syntax-based, intuitive language anyone can use. |
| Data Management | SAS offers robust data management, handling large datasets with ease. | The platform is less powerful than SAS in this aspect. |
| Market Penetration | It serves several industries like healthcare, finance and research. | SPSS caters to social sciences, marketing research and education. |
| Cost | It’s expensive. | Versions include lower-priced options for individuals. |
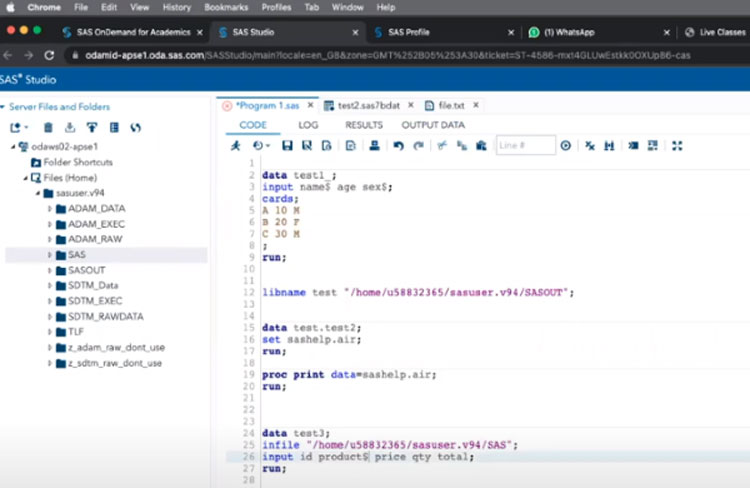
SAS offers a programming language for data analysis. Source
Is SPSS software free?
The vendor offers a 30-day full-feature platform trial, though it doesn’t include technical support.
IBM offers paid academic packages for students, faculty and universities. Commercial versions include Base, Standard, Premium and Professional packages.
Alternatively, you can opt for a monthly or annual subscription. Visit the vendor’s website for details.
How is SPSS different from Excel?
| SPSS | Excel | |
|---|---|---|
| Data Analysis | It’s designed for statistical analysis. | It’s a spreadsheet solution focusing on organizing data and performing calculations. |
| Statistical Tools and Methods | It supports research via ANOVA and parametric and non-parametric tests. | The tool offers essential statistical functions like SUM, AVERAGE and COUNT. |
| Ease of Use | SPSS has an intuitive, menu-driven interface. | Complex statistical analysis may require more manual effort. |
| Applications | It serves social science, marketing and academic researchers. | Excel caters to business users and finance professionals. |
Next Steps
Statistical software solutions free you from the drudgery of performing complex calculations for data analysis. Besides, they help you avoid the pitfalls of manual analysis, like missing critical insight by oversimplifying solutions.
Not sure how to go about your software search? Get started with our handy resources.
Generate a custom comparison scorecard to analyze the statistical tools on your shortlist. Get a feature-by-feature analysis of each product on a scale of zero to 100.
Gain an at-a-glance color-coded overview of features depending on whether the product supports them fully, moderately, with partner integrations, workarounds or not at all.
Call us for a consultation for your specific needs.
Which statistical software have you used? How did it help? Do share your thoughts in the comments section below!
Analyst-Picked Related Content
Pricing Guide: Discover the true cost of BI Tools
Comparison Report: An interactive analyst report with comparison ratings, reviews and pricing for BI Tools

6 comments
Join the conversationnamrata - May 29, 2023
The Nekopoi APK is an easy-to-use platform with an anime-themed appearance.
ancygl - May 18, 2023
Nice blog
Hassan - December 20, 2022
This is insightful. Thank you.
Ritinder Kaur - December 20, 2022
We’re glad you found it helpful, Hassan! Keep reading!
psikolog jogja - September 9, 2021
Great post.
Ritinder Kaur - June 20, 2022
Thank you! We’re glad you liked it.