Best Predictive Analytics Software Tools

Predictive Analytics software are tools that use machine learning algorithms and statistical models to analyze historical data and make predictions about future events or trends. These software tools help organizations identify patterns, forecast outcomes, and make data-driven decisions. The software is used in various industries, including finance, healthcare, marketing, and manufacturing.

Buyer's Guide

Last updated on September 28th, 2023
Predictive Analytics Software Is All About Learning About Future Trends 

Predictive Analytics Software BG Intro Header

Capturing business intelligence to plan for the future is driving companies to the top of the pile in the data-rich world of 21st-century enterprise. They achieve this with BI solutions; several are predictive analytics tools. They provide statistical functions, mathematical calculations and data modeling to drive forecasts about future market trends and opportunities.

Choosing a predictive analytics tool can be overwhelming among many solutions offering similar features. This software buyer’s guide informs you about predictive analytics software, its benefits, features and the top three market leaders.

Executive Summary

  • Predictive analytics gives companies greater control over their business strategies by providing a glimpse into future trends.
  • Predictive analytics tools help you get ahead of your competitors by taking advantage of upcoming opportunities and preempting risks.
  • An efficient predictive solution should provide autonomous analytics capabilities with secure, self-service data modeling and a rich visualization library.
  • Ask the right questions within your company and predictive analytics vendors to aid your software selection process.

What This Guide Covers:

What is Predictive Analytics Software?

Predictive analytics solutions provide business forecasts through statistical functions, mathematical calculations and data modeling. Companies can capitalize on market trends by taking advantage of these tools' insights into business opportunities.

While organizations gather business intelligence from user insights, predictive platforms go further. They allow you to tweak data as needed and view its impact on dependent variables through data modeling, what-if analysis and regression analysis. Predictive software lets you take a peek into the future, assess how your business is doing and decide what you need to do to get the best results.

Primary Benefits

Why do businesses use predictive analytics solutions?

Predictive Analytics Benefits

Get Ahead in the Market

You can get a near-accurate market forecast by combining customer insights with variables like socioeconomic factors, seasonality and location. Utilizing business assets to predict customer preferences, trends and upcoming opportunities can put your company ahead of its competitors.

You can identify where you’re losing revenue by analyzing customer churn and cart abandonment metrics to plug the gaps. Forecasting helps you plan better by assessing how your customers are likely to respond to changes in your sales strategies.

Make Informed Decisions

Retail, healthcare, financial, insurance companies and several other domains use the power of predictions to make intelligent decisions. Routine EHR data serves as an excellent source to predict health outcomes or diagnoses for clinical decision support and trial recruitment. Physicians need not waste time searching for the best-suited treatment options; this is especially significant for treating time-critical medical conditions.

You can alter your marketing strategies to boost conversion with timely business predictions. Or prevent churn by offering loyalty programs and discounts for customers planning to shift elsewhere. You can decide which products to push and which ones to downscale based on demand forecasts.

Boost Efficiency

Besides client business, predictive software streamlines internal processes by helping you analyze your company’s operational metrics. You can integrate enterprise resource planning and workforce management with project management. Allocating resources by anticipating the project load can help you scale faster and finish projects on schedule.

Employee management includes payroll, HR and performance management, which can benefit from predictive insights. Forecasting employee turnover with the appropriate predictive systems informs your HR team how many people you need to hire over, say, the next six months. Your predicted expenses and revenue over the same period can tell you whether you can afford onboarding and training.

Mitigate Risk

Predictive business analytics tools reduce risk in two ways – forecasting loss-making investments and preventing fraud. Banks and lenders can vet loan applicants by assessing the likelihood of timely premium payments based on their profile, credit repayment history and income. Similarly, insurance companies use predictions to verify policy applicants’ credibility, saving underwriting overheads.

Predictive tools prevent fraud by spotting loopholes in workflows and security protocols for financial companies, banks and healthcare. They help organizations handle insider threats and data breaches proactively, rather than reacting after they’ve happened.

Keep Your Hardware in Top Shape

Predictive techniques built into company hardware let you monitor heavy machinery and issue periodic alerts for maintenance and upgrades. It prolongs your machines’ life, saving you thousands of dollars. Preventive maintenance is crucial for companies with lots of heavy equipment in the field.

A predictive tool that lets you do this from a single, centralized hub is convenient and optimal.

Key Features & Functionality

When buying a predictive tool, it’s better to prepare a requirements checklist beforehand that includes your must-have and nice-to-have features. For instance, your business probably needs statistical analysis capabilities, but does it need artificial intelligence? Although AI can do many great things, it may not be worth an investment right away, and what would that look like for implementation?

Here are some essential features an excellent predictive analytics tool should have.

Big Data Integration

The predictive analytics solution should help you maximize the value of your proprietary assets with connectors and integrations. It should pull information from images, audio files, videos, social media sites, CSV, XML and log files. Ingests information from databases and warehouses in the cloud, on premise and everything in-between.

Data Mining

You can extract useful information from all possible sources. Searches large repositories to discover patterns and trends that go beyond simple analysis. Predicts the likelihood of future events by connecting the dots between existing insights.

Data Modeling

Creates predictive models with statistical functions and mathematical calculations. Simulates what-if scenarios by letting you tweak key metrics and view the impact. It enables reverse-engineering of outcomes — define the desired results first and go back to view the key metrics.

Self-Service Analytics

Create visualizations with handy tools on a user-friendly interface. Autonomously sort, filter and drill down into metrics to view insights that matter to your role. Collaborate with others on intuitive dashboards by leaving comments and annotations through @mentions.

Data Visualization

View and present several linked metrics visually on a single, unified interface. Design visual aids like charts, graphs and maps to convey actionable insights. Choose from a rich library of visualizations — bar charts, histograms, pie charts, heat maps, scatter plots, box plots and more — and customize them as needed.

Reporting

View and share predictive business reports with stakeholders. Analyze forecast trends to factor in when designing business strategy. Extract relevant insights at will with ad hoc reporting through filtering, highlighting, pivoting and more.

Security

Secures business data with authentication protocols, SSO and role-based permissions. Track user activity through logs and audit trails.

Embedded Analytics

Lets you enhance your software offerings by adding embeddability to its tech stack. Embed analytics capabilities or white label the software to view forecasts and market trends within business applications.

Software Comparison Strategy

Several predictive tools offer similar features, and choosing the right solution can be difficult. Taking it step-by-step helps make the process easier. Start by listing your implementation goals and which attributes can help you achieve them.

We have provided a list of questions below to ask yourself and potential predictive analytics software vendors to narrow down your choices. Additionally, we offer a great list of resources to help you select software. Gather your requirements into a checklist with our BI requirements template.

Or go through our comparison matrix for a feature-by-feature analysis of leading predictive solutions.

Choosing predictive business analytics software can take time, but putting in the effort beforehand will pay off in the long term.

Cost & Pricing Considerations

The cost of a predictive analytics tool can make or break your buying decision. While narrowing down your software options, check the cost of deployment, especially whether you will get implementation support from the vendor. If not, you will need to pencil in the cost of hiring external IT resources, if you don’t have an in-house team.

Check how much data storage the vendor provides, with add-ons and user capacity on offer. Verify whether your plan will include email, phone and chat support or if you will need to subscribe to a paid plan. Look up the product cost on the vendor’s website or reach out to them for detailed quotes. Check out which software solutions are within your price range with our pricing guide.

Most Popular Predictive Analytics Software

The below solutions lead the pack in predictive analytics per research performed by the SelectHub analyst team.

Tableau

Tableau is famous globally for its rich visualizations that are free to view and download. You can analyze business assets through model-building with statistical calculations and predictive functions. The slice and dice action enables moving through different views of a visualization quickly.

Automated clustering helps discover previously unidentified patterns that would be difficult to spot in large, complex data sets. You can explore the impact of seasonality on market trends with period-over-period analysis.

Tableau

Population Segmentation Based on Multidimensional Dataset Clustering.

Power BI

Known for its intuitive interface, Power BI enables power users of all skill levels to forecast business trends with its AutoML module. The key influencers visualization helps draw attention to key metrics drivers, making it easier to convey pertinent information. Decision tree visuals let you present various possible courses of action and their potential outcomes.

If you’re using Dynamics 365, Microsoft Teams or Power Apps, you can embed Power BI reports and dashboards within your applications for handy insights. Or, you can white label the solution to give your end-users a seamless experience.

Power BI

The Key Influencers Visual Showing Guest Analytics for a Hotel.

Board

Board is known for its robust EPM and BI capabilities. Its in-memory data management solution, the Hybrid Bitwise Memory Pattern, performs discretionary full, on-demand and hybrid data processing. With efficient data compression and high user concurrency, the HBMP technology speeds up the time to insight.

The platform supports forecasting through what-if analysis and profitability modeling. Additionally, you can utilize its predictive capabilities for internal workflows like financial reporting, budgeting, planning, monitoring and auditing.

Board

A Sales Intelligence and Planning Dashboard.


Questions to Ask Yourself

Predictive Analytics BG Key Questions To Ask

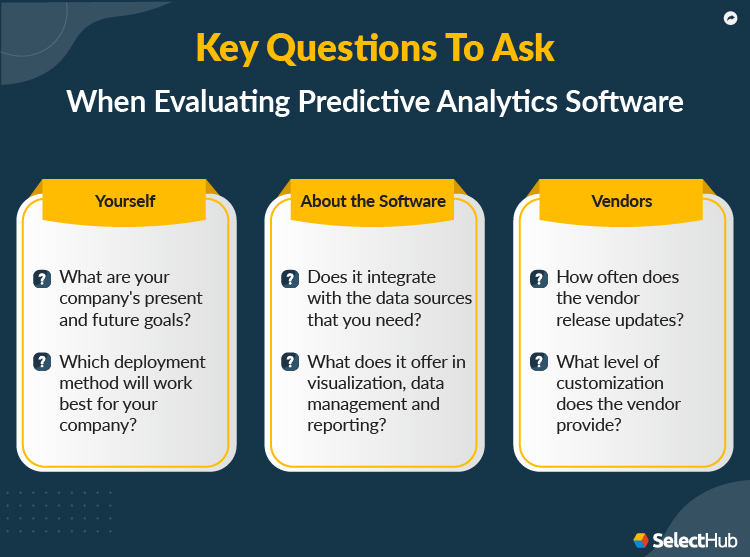
Use these questions as a starting point for internal conversations:

  • What’s your budget? Is your current tool a money sink?
  • Who will use the predictive analytics tool, and which features will they need?
  • What are your company's present and future goals? How will the software fit with your company’s product roadmap?
  • Which deployment method will work best for your company — on-premise, cloud-based or hybrid?
  • How important is scalability?
  • What databases does it need to integrate?

Questions to Ask Vendors

To evaluate the various software available in the market, use these questions to start conversations with predictive analytics software vendors.

About the Software

  • What does the tool offer in visualization, data management, reporting and collaboration?
  • Can it integrate with add-ons and other applications to provide a seamless user experience?
  • Will it need customization before deployment?
  • Does the tool integrate with the data sources that you need?
  • Is it available as a native mobile application? What functionalities are included on mobile?
  • Is the tool user-friendly and easy to navigate for users of all technical skills?

About the Vendor

  • What’s the workflow to create predictive data models?
  • Which visualizations does it offer?
  • How often does the vendor release updates and enhancements?
  • What level of customization does the vendor provide?
  • Which features will cost extra?
  • What are the available pricing tiers, and which capabilities do they provide?
  • Does the predictive analytics vendor specialize in predictive analytics solutions?
  • Does the vendor provide demos? Is a free trial available?

In Conclusion

Choosing a predictive analytics solution is a task that demands proper research and preparation. This buyer’s guide is intended to be a starting point for IT professionals tasked with selecting predictive analytics software in their research.

Product Comparisons

Additional Resources

Tableau

User Sentiment:
User satisfaction level icon: great

Tableau is a data visualization and analytics solution that assists enterprises in making data-driven business decisions. It blends information from a wide range of sources to deliver actionable, real-time insights. It allows exploration of data via intuitive means such as drag-and-drop filtering and natural language queries, irrespective of skill levels. With ample customization and security options, it offers control over data visualization, enabling creation of dashboards and stories that effectively convey business narratives. It can be purchased as part of the Tableau Creator package, which includes the desktop version, Prep and a Creator license of the server or online version.

PRICE
$
$
$
$
$
DEPLOYMENT
COMPANY SIZE
S
M
L
PLATFORMS

Request with no obligation:

PRICEDEMO

Power BI

User Sentiment:
User satisfaction level icon: great

Microsoft Power BI is an analytics tool that assists in reporting, data mining and data visualization to provide business insights. Through Power BI's simple interface, businesses can connect to a variety of data sources and create their own dashboards and reports. Originally born from Excel as an add-on, Power BI has since grown to stand on its own. At a relatively low cost, Power BI fulfills the needs of organizations ranging from small business owners to enterprise operators. There are three versions: Desktop, which is available for free for individual use, an upgraded Pro plan offered on a monthly price-per-user SaaS subscription and a capacity-based Premium plan which provides enterprise-level insights with on-premise deployment and a dedicated cloud infrastructure.

PRICE
$
$
$
$
$
DEPLOYMENT
COMPANY SIZE
S
M
L
PLATFORMS

Request with no obligation:

PRICEDEMO

Board

User Sentiment:
User satisfaction level icon: great

Board is a robust solution that offers analytical insights, business analytics and enterprise performance management all under the same hood. It helps key players of a company improve the effectiveness of their decision making. Its customizable and interactive dashboards give enterprises the ability to see a high-level overview of their business, as well as drill down into their KPIs to assess business performance goals. It serves mid- to large-sized companies across various industries, and its programming-free toolkit helps businesses analyze and plan with a tailored, efficient approach, irrespective of technical skill levels.

PRICE
$
$
$
$
$
DEPLOYMENT
COMPANY SIZE
S
M
L
PLATFORMS

Request with no obligation:

PRICEDEMO

QlikView

User Sentiment:
User satisfaction level icon: great

QlikView is a data discovery and customer insight platform from Qlik, a leader in the insight and intelligence space. However, it is not available for purchase any longer. Qlik Sense, Qlik’s next-generation offering, is available for new customers. It offers self-service data that can help drive decisions and generate significant ROI for technical skill level users. It’s built from the ground up to be affordable, scalable and adaptable. It can ingest data from diverse sources like big data streams, file-based data, and on-premise or cloud data. It is well-known for its data associations and relationship functionality, keeping data in context automatically. It delivers results quickly via its patented in-memory data processing module, processing data down to as little as 10% of its original size.

PRICE
$
$
$
$
$
DEPLOYMENT
COMPANY SIZE
S
M
L
PLATFORMS

Request with no obligation:

PRICEDEMO

Spark

User Sentiment:
User satisfaction level icon: great

Apache Spark is an open source unified analytics software for distributed, rapid processing. It distributes data across clusters in real time to produce market-leading speeds. It is rising in popularity in the space, catching up to its sister-offering, Hadoop, because of its quicker speeds and specific focus on optimizing processing performance and ability to stream data. It supports several coding languages, including Python, R, Scala, SQL and Java. It can function stand-alone, or be integrated into broader workflows easily.

PRICE
$
$
$
$
$
DEPLOYMENT
COMPANY SIZE
S
M
L
PLATFORMS

Request with no obligation:

PRICEDEMO

SAS Visual Analytics

User Sentiment:
User satisfaction level icon: great

SAS Visual Analytics offers fast answers to complex questions drawn from datasets of all sizes. It provides guided exploration, interactive dashboards, smart visualizations and self-service analytics to users of all technical skill levels, promoting data literacy and visibility. Its versatile, scalable design helps users make better business decisions based on data transparency. Built on a cohesive in-memory architecture, it promotes intelligent action driven by insight.

PRICE
$
$
$
$
$
DEPLOYMENT
COMPANY SIZE
S
M
L
PLATFORMS

Request with no obligation:

PRICEDEMO

Qlik Sense

User Sentiment:
User satisfaction level icon: great

Qlik Sense is a self-service data analytics software that enhances human intuition with the power of artificial intelligence to enable better data-driven business decisions. It allows organizations to explore their data and create intuitive and compelling visualizations from data insights with drag-and-drop simplicity. As the next-generation advancement of QlikView, released in 2014, it expands analytical possibilities to support the entire insights life cycle and helps businesses modernize their approach to intelligence. It has two editions: Business and Enterprise, offered on a per account annual subscription. Enterprises can choose between a hosted SaaS public cloud or multi-cloud, on-premise or private cloud deployment. Qlik Sense Business comes with a free 30-day trial. Its desktop version is available for free for personal use.

PRICE
$
$
$
$
$
DEPLOYMENT
COMPANY SIZE
S
M
L
PLATFORMS

Request with no obligation:

PRICEDEMO

Dundas BI

User Sentiment:
User satisfaction level icon: great

Dundas BI is a browser-based analytics platform built to embed from the ground up. The vendor provides single and multi-tenant deployments with access to shared, reusable content. HTML5 enables customizable visualizations and user-friendly dashboards to build reports with interactivity options to drill down into data on demand. It allows secure write-backs to the database, capturing input through custom forms, stored procedures and REST APIs. It gives businesses complete control over the data stored on their IT infrastructure. The vendor offers a 25-day free trial.

PRICE
$
$
$
$
$
DEPLOYMENT
COMPANY SIZE
S
M
L
PLATFORMS

Request with no obligation:

PRICEDEMO

Cognos Analytics

User Sentiment:
User satisfaction level icon: great

IBM Cognos Analytics is a self-service, web-based analytics platform which empowers users of all skill levels to explore data through reporting, data analytics, KPI monitoring, events and metrics. Reports give users the ability to not just visualize their insights, but also share them with colleagues. It integrates with Watson Analytics, which leverages IBM’s artificial intelligence and natural language processing to make insights more accessible to non-technical users. It has various components which give additional functionality, flexibility and agility when processing large sets of data.

PRICE
$
$
$
$
$
DEPLOYMENT
COMPANY SIZE
S
M
L
PLATFORMS

Request with no obligation:

PRICEDEMO

Looker

User Sentiment:
User satisfaction level icon: great

Looker is a web-based analytics solution that offers businesses the ability to explore, discover, visualize and share data insights. Enterprises can view data sources and drill down into data to better understand their business and metrics. Using a simple proprietary modeling language, this system helps define data relationships while bypassing SQL. It facilitates data literacy and accessibility, irrespective of technical skill levels. It was acquired by Google on June 6, 2019, for $2.9 billion.

PRICE
$
$
$
$
$
DEPLOYMENT
COMPANY SIZE
S
M
L
PLATFORMS

Request with no obligation:

PRICEDEMO

Sisense

User Sentiment:
User satisfaction level icon: great

Sisense is an end-to-end data analytics platform that makes data discovery and analytics accessible to customers and employees alike via an embeddable, scalable architecture. With a back-end powered by in-chip technology, it allows analysts to blend large datasets from a variety of sources into a single cohesive database for the entire company. On the front-end, users of all technical skill levels can craft visualizations, reports and dashboards to explore and share insights that drive businesses forward. Its AI-driven, cloud-native analytics offering, Fusion, embeds into business workspaces and empowers teams to view key metrics and data insights where they work. Designed for companies of all sizes, it can be deployed on-premises, as a private cloud-hosted SaaS, as a fully managed SaaS or via a hybrid strategy. It is available via annual subscription pricing and offered in three packages: its main offering BI Analytics Teams, its embedded analytics component Product Teams and code-driven cloud analytics through Cloud Data Teams.

PRICE
$
$
$
$
$
DEPLOYMENT
COMPANY SIZE
S
M
L
PLATFORMS

Request with no obligation:

PRICEDEMO

Spotfire

User Sentiment:
User satisfaction level icon: great

TIBCO Spotfire is a complete business intelligence and data discovery platform that can perform various functions, including in-depth analysis and robust visual reporting, all powered by artificial intelligence. It offers data streaming technology, which can support insights with AI, big data integration, integration with the Internet of things (IoT) and more.

PRICE
$
$
$
$
$
DEPLOYMENT
COMPANY SIZE
S
M
L
PLATFORMS

Request with no obligation:

PRICEDEMO

Pentaho

User Sentiment:
User satisfaction level icon: great

Pentaho Business Analytics helps users gain insights to drive decisions and manage their data. Notable features include data visualization, dashboards, data modeling, reporting, role-based security, mobile access and a host of analytics capabilities. It serves customers of any size in all industries and can be delivered in the cloud or as an embedded implementation. It’s built on open-source principles to leverage existing data against future data and has enough to offer users of any skill level.

PRICE
$
$
$
$
$
DEPLOYMENT
COMPANY SIZE
S
M
L
PLATFORMS

Request with no obligation:

PRICEDEMO

Sisense For Cloud Data Teams

User Sentiment:
User satisfaction level icon: great

Formerly known as Periscope Data, Sisense for Cloud Data Teams is a data analytics software tool that integrates seamlessly with the Sisense platform, offering advanced analytics that delivers actionable insights to teams that work with data in the cloud. It provides a single, cohesive interface for users to store, organize, analyze and visualize all their data for better decision-making. It empowers users of all kinds to produce, consume and share insights intuitively together, with or without coding knowledge. Originally founded in 2012 in San Francisco, California, it was acquired by Sisense in May 2019 and rebranded in January 2020.

PRICE
$
$
$
$
$
DEPLOYMENT
COMPANY SIZE
S
M
L
PLATFORMS

Request with no obligation:

PRICEDEMO

BusinessObjects

User Sentiment:
User satisfaction level icon: great

BusinessObjects from SAP offers a variety of packages to fit businesses of all industries and sizes. It aims to reduce the cost of IT upkeep and increase responsiveness to business problems. It streamlines workloads and lets users share insights to make better business decisions.

PRICE
$
$
$
$
$
DEPLOYMENT
COMPANY SIZE
S
M
L
PLATFORMS

Request with no obligation:

PRICEDEMO

ThoughtSpot

User Sentiment:
User satisfaction level icon: great

ThoughtSpot offers analytics and insight capabilities to industries seeking a deeper understanding of their proprietary data in order to make data-driven business decisions. It focuses on giving nontechnical users access to processing and analytics, bringing the ease of a search function to enterprise-scale data analysis. It offers a powerful search engine integrated with in-memory computing for a consumer-class UI.

PRICE
$
$
$
$
$
DEPLOYMENT
COMPANY SIZE
S
M
L
PLATFORMS

Request with no obligation:

PRICEDEMO
Call SelectHub for a free 15-minute selection analysis: 1-855-850-3850

Domo

User Sentiment:
User satisfaction level icon: great

Domo is a cloud-based business management suite that accelerates digital transformation for businesses of all sizes. It performs both micro and macro-level analysis to provide teams with in-depth insight into their business metrics as well as solve problems smarter and faster. It presents these analyses in interactive visualizations to make patterns obvious to users, facilitating the discovery of actionable insights. Through shared key performance indicators, users can overcome team silos and work together across departments.

PRICE
$
$
$
$
$
DEPLOYMENT
COMPANY SIZE
S
M
L
PLATFORMS

Request with no obligation:

PRICEDEMO

Black Knight

User Sentiment:
n/a

Black Knight offers an extensive suite of cloud-based solutions for businesses to improve decision-making through actionable data insights. It provides a unified end-to-end framework that combines its big data assets with data collection, visualization and analytics. Armed with multilingual support, machine learning techniques and an intuitive interface, it helps enterprises generate leads, adhere to compliance guidelines and increase process efficiencies.Though aimed at the mortgage and mortgage-related industry, it also offers data analytics to suit the needs of a range of other industries. Some of its industry-specific inclusions include hedge, enterprise, market and competitive analytics. Customers can opt for the origination, servicing or home equity collections, each focused on addressing specific challenges or utilize all three collections for expanded visibility.

PRICE
$
$
$
$
$
DEPLOYMENT
COMPANY SIZE
S
M
L
PLATFORMS

Request with no obligation:

PRICEDEMO

Klipfolio

User Sentiment:
User satisfaction level icon: excellent

Klipfolio is an analytics software tool that helps users wield data intelligently and confidently by building dashboards and reports that track KPIs and monitor trends. Users can glean insights from information across the organization collected in one convenient place and deploy interactive data visualizations that they can share with ease. It is available through an annual or monthly subscription to one of four plans: Publish, Grow, Team and Team+. The number of dashboards and users allowed, as well as the data refresh rate and level of support varies depending on the pricing plan selected.

PRICE
$
$
$
$
$
DEPLOYMENT
COMPANY SIZE
S
M
L
PLATFORMS

Request with no obligation:

PRICEDEMO

MicroStrategy

User Sentiment:
User satisfaction level icon: great

MicroStrategy is a data analytics platform that delivers actionable intelligence to organizations of all sizes. It allows users to customize data visualizations and build personalized real-time dashboards. It leverages data connectivity, machine learning and mobile access to offer users comprehensive control over their insights. Due to its ease of use and scalability, it stands out as a leader in the enterprise analytics field. Users can choose between cloud, on-premise or hybrid deployment according to their needs.

PRICE
$
$
$
$
$
DEPLOYMENT
COMPANY SIZE
S
M
L
PLATFORMS

Request with no obligation:

PRICEDEMO

Oracle Analytics Cloud

User Sentiment:
User satisfaction level icon: great

Oracle Analytics Cloud is an AI-powered solution that provides robust reporting and analytics features to businesses of all sizes. It offers a strong selection of reporting and analytics features from the convenience of the cloud. It prepares and analyzes data for trends, then turns that data into an intuitive visualization for users to explore and share. This helps users get a deeper understanding of a range of business questions as well as make accurate predictions and forecasts.

PRICE
$
$
$
$
$
DEPLOYMENT
COMPANY SIZE
S
M
L
PLATFORMS

Request with no obligation:

PRICEDEMO

Infor Birst

User Sentiment:
User satisfaction level icon: great

Infor Birst is a cloud-based analytics software tool that aims to help users discover insights without the need for analyst input. It unifies IT-managed enterprise data with user-owned data, supporting the blending of both in a top-down and bottom-up manner. It uses consistent business metrics to structure raw data into organized sets and visualizations. It helps users identify patterns and better understand their organization’s KPIs. It offers a seamless, integrated UI that allows users to perform every step of the data analysis process in a single interface, enabling a smooth experience. It can be deployed either from the cloud or self-hosted on-premise. Users can purchase it in three available formats: per-user fee, by department or business unit or by end-customer in embedded scenarios.

PRICE
$
$
$
$
$
DEPLOYMENT
COMPANY SIZE
S
M
L
PLATFORMS

Request with no obligation:

PRICEDEMO

Zoho Analytics

User Sentiment:
User satisfaction level icon: great

Zoho Analytics (formerly Zoho Reports) allows users to create visualizations and dashboards to present their data via a quick, easy, self-service model. It brings insight and analysis to an organization’s business data on-demand without needing IT assistance or data analysts through extensive automation efforts in several dimensions of the analytical process. Users can crunch huge datasets, clean and blend data, perform various analytical tasks and visualize the results in dynamic graphics to uncover insights. They can make data-informed business decisions in a stand-alone or embedded environment with support for mobile devices. It has flexible on-premise or cloud deployment models.

PRICE
$
$
$
$
$
DEPLOYMENT
COMPANY SIZE
S
M
L
PLATFORMS

Request with no obligation:

PRICEDEMO

BIRT

User Sentiment:
User satisfaction level icon: great

It’s an open-source project on Eclipse and is an acronym for Business Intelligence and Reporting Tools. It lets organizations extract and transform data for business analysis. Its Report Designer enables visual report-building within interactive dashboards. The runtime component executes the reports once ready. Embedded into a range of business interfaces, it enables custom design layout, data access and scripting to present report output over the web. It supports charts, crosstabs, using multiple data sources within the same report, re-using queries within reports and addition of custom code.

PRICE
$
$
$
$
$
DEPLOYMENT
COMPANY SIZE
S
M
L
PLATFORMS

Request with no obligation:

PRICEDEMO

GoodData

User Sentiment:
User satisfaction level icon: great

GoodData is a powerful, embeddable, customizable SaaS solution that combines, analyzes and visualizes the internal and external data of an organization to help businesses change the way they make decisions, with a focus on data-driven best practices. It lets users process data, analyze trends and create visualizations that present information in an easily-digestible format. Users can interpret these visualizations to draw insights and make intelligent business decisions.

PRICE
$
$
$
$
$
DEPLOYMENT
COMPANY SIZE
S
M
L
PLATFORMS

Request with no obligation:

PRICEDEMO

ibi

User Sentiment:
User satisfaction level icon: great

Ibi by Information Builders offers cloud-based data and analytics platforms that empower users to turn their information into insights through robust visualization, reporting and data management. WebFOCUS is its primary offering. Flexible, configurable and scalable, it integrates data from many sources, simplifies data workflows and enables fast, easy organization and analysis of data. It allows users to make more confident data-driven decisions that drive business results.As of 2020, the vendor has announced that it will be acquired by TIBCO.

PRICE
$
$
$
$
$
DEPLOYMENT
COMPANY SIZE
S
M
L
PLATFORMS

Request with no obligation:

PRICEDEMO

Jaspersoft

User Sentiment:
User satisfaction level icon: good

Jaspersoft is a reporting and data analytics suite built around the JasperReports engine that helps businesses create seamlessly embeddable, pixel-perfect reports, dashboards and visualizations. It empowers businesses with the self-service capabilities to find answers to data questions through beautifully rendered visuals that are easy to understand and explain. Bridging the gap between insight and action, it promotes ownership of the decision-making process across organizations. It includes JasperReports Library, JasperReports Server and JasperReports Studio. The vendor also offers a cloud and microservice-embeddable reporting engine, JasperReports IO.

PRICE
$
$
$
$
$
DEPLOYMENT
COMPANY SIZE
S
M
L
PLATFORMS

Request with no obligation:

PRICEDEMO

RStudio

User Sentiment:
User satisfaction level icon: excellent

RStudio is an integrated development environment suite for the R programming language, synthesizing coding tools into one software tool for easier advanced data processing. Using in-memory processing, it is capable of parsing big data through integrations and connections. It is available in both open-source and commercial formats, with extra features available in the paid edition includes more sophisticated collaboration and security efforts. The free version is capable of end-to-end analytics, from API connectivity and data ingestion to visualization creation and distribution. It can be deployed standalone or on a web browser through connection to RStudio Server.

PRICE
$
$
$
$
$
DEPLOYMENT
COMPANY SIZE
S
M
L
PLATFORMS

Request with no obligation:

PRICEDEMO

Pyramid Analytics

User Sentiment:
User satisfaction level icon: great

Pyramid Analytics offers an enterprise-grade operating system that scales smoothly from single-user to organization-wide implementation. It’s OS agnostic and can be deployed in the cloud or on-premise. It promotes data literacy by allowing different levels of users to utilize different capabilities. It is designed to support an organization’s decision workflow end-to-end from self-service analytics to forecasting.

PRICE
$
$
$
$
$
DEPLOYMENT
COMPANY SIZE
S
M
L
PLATFORMS

Request with no obligation:

PRICEDEMO

JReport

User Sentiment:
User satisfaction level icon: excellent

JReport by Logi Analytics (now discontinued) empowered companies to perform data analysis and generate reports directly from other business applications. It was scalable, customizable, fault-tolerant and worked seamlessly within other web interfaces. It integrated with any architecture and supported a range of embedding methods from the front and back ends.

PRICE
$
$
$
$
$
DEPLOYMENT
COMPANY SIZE
S
M
L
PLATFORMS

Request with no obligation:

PRICEDEMO

Izenda

User Sentiment:
User satisfaction level icon: great

Izenda (replaced by Logi Symphony) is a business intelligence product that allows users to embed reporting and analytics capabilities into other applications. It monetizes data, promotes data literacy, offers insights and sets users up to make data-driven business decisions.From ad-hoc reports to ongoing insights, this software tool offers users a flexible range of data analysis features and visualization capabilities. It was designed for both developers and end users with a modern technology stack, flexible architecture and intuitive drag-and-drop interface.

PRICE
$
$
$
$
$
DEPLOYMENT
COMPANY SIZE
S
M
L
PLATFORMS

Request with no obligation:

PRICEDEMO

Exago

User Sentiment:
User satisfaction level icon: excellent

Exago (replaced by Logi Symphony) is embeddable, flexible and scalable. It is designed for multi-tenant SaaS use and requires no additional desktop downloads or plug-ins. It offers an open API and customizable UI, giving users control and flexibility. It includes express reports, pixel-perfect reports, report formatting templates, crosstab reports, drill-down, a dashboard designer, maps, data blending and OLAP.

PRICE
$
$
$
$
$
DEPLOYMENT
COMPANY SIZE
S
M
L
PLATFORMS

Request with no obligation:

PRICEDEMO

WebFOCUS

User Sentiment:
User satisfaction level icon: great

WebFOCUS is a data analytics solution from Information Builders that helps businesses transform their data into actionable insights. Its intuitive interface makes self-service intelligence accessible to users of all skill levels. Its capabilities include dashboards, scorecards, mobile access, guided ad hoc reporting, data integrations, dynamic report distribution and much more. As of 2020, the vendor has announced that it will be acquired by TIBCO.

PRICE
$
$
$
$
$
DEPLOYMENT
COMPANY SIZE
S
M
L
PLATFORMS

Request with no obligation:

PRICEDEMO

ClearStory Data

User Sentiment:
User satisfaction level icon: great

ClearStory Data was acquired by Alteryx in 2019. Data access and analysis were once relegated to specialists, quants or statisticians. Today, competitiveness on the front lines of business is dictated by the speed of data access and the quality of informed decision-making. ClearStory Data’s end-to-end solution includes an integrated Spark-based data processing platform and an incredibly simple user application for business consumption of insights.

PRICE
$
$
$
$
$
DEPLOYMENT
COMPANY SIZE
S
M
L
PLATFORMS

Request with no obligation:

PRICEDEMO

Datorama

User Sentiment:
User satisfaction level icon: great

Datorama helps businesses handle their processing and analysis needs for data sets of any size and complexity. It is scalable and cloud-based for growth, access and convenience. Powered by Salesforce, it’s built to provide enterprise-grade intelligence and insights.

PRICE
$
$
$
$
$
DEPLOYMENT
COMPANY SIZE
S
M
L
PLATFORMS

Request with no obligation:

PRICEDEMO

RapidMiner

User Sentiment:
User satisfaction level icon: excellent

The RapidMiner platform is a cloud-based series of data intelligence offerings, capable of all layers of a big data ecosystem. It can work with structured and unstructured data alike, preparing, blending, analyzing and visualizing it. It utilizes a code-free interface for designing big data workflows and integrations, capable of the complete data science life cycle. It can achieve top-level analytics like machine learning and predictive modeling. Its cloud deployment comes in managed or on-demand options. It has open-source and commercial versions.

PRICE
$
$
$
$
$
DEPLOYMENT
COMPANY SIZE
S
M
L
PLATFORMS

Request with no obligation:

PRICEDEMO

Real People... with Data

We know selecting software can be overwhelming. You have a lot on the line and we want you to make your project a success, avoiding the pitfalls we see far too often.

As you get started with us, whether it be with Software Requirements templates, Comparing, Shortlisting Vendors or obtaining that elusive Pricing you need; know that we are here for you.

Our Market Research Analysts will take calls, and in 10 minutes, take your basic requirements and recommend you a shortlist to start with.

Narrow Down Your Solution Options Easily

close

Applying filters...

Search by what Product or Type or Software are you looking for