Best Ecommerce Analytics Software Tools

Ecommerce analytics software tools are digital solutions designed to help businesses analyze and gain insights from their online sales and customer data. These tools typically provide features for tracking website traffic, conversion rates, and revenue performance. Additionally, they may offer functionalities for customer segmentation, product analysis, and sales forecasting. Ecommerce analytics software tools empower businesses to optimize their online strategies, improve customer experiences, and drive revenue growth by leveraging data-driven insights.

Buyer's Guide

Last updated on October 6th, 2023
Ecommerce Analytics Software Is All About Analyzing Real-Time Data to Gain Insights About Consumer Behavior and Demographics 

Ecommerce Analytics BG Intro

Ecommerce analytics tools analyze real-time data from eCommerce stores to analyze consumer behavior, identify best-selling products and gauge conversion rates. Ecommerce business intelligence solutions give you an end-to-end view of your business and obtain actionable insights to boost performance and invest in lucrative strategies.

Executive Summary

  • Ecommerce analytics solutions track and analyze data to offer a seamless consumer experience.
  • Some of the benefits of eCommerce analytics solutions include personalizing shopping experiences, detecting fraud and ensuring price optimization.
  • Tableau, Power BI and Looker are popular eCommerce analytics tools.
What This Guide Covers:

What Is Ecommerce Analytics Software?

Ecommerce analytics software tracks online retailers’ performance. It helps you identify top-selling products, monitor and track consumer behavior, and analyze issues that affect business performance. It empowers retailers to boost sales and provide seamless consumer experiences.

Primary Benefits

Ecommerce Analytics Software Benefits

Build Robust Supply Chains

Customers prefer to shop online for two reasons, convenience and affordable prices. To boost the customer experience, you should ensure the products are available in sufficient quantities. Slow deliveries can result in poor customer satisfaction, negatively affecting customer lifetime value.

Detect Fraud

Gauge transactions to detect patterns and anomalies based on consumer behavior. Send notifications to customers if you find suspicious activities before processing transactions.

Make Accurate Predictions:

Determine future trends based on various factors, including transaction volume, product categories, seasonality and more. It helps you ascertain how future sales look to stock sufficient products in inventory and create robust marketing strategies.

Personalize Shopping Experiences

Understand customer demographics and online behavior to create robust buyer personas and determine product strategy. Customize shopping experiences and send recommendations to customers based on their preferences.

Optimize Product Pricing

Product prices are determined by demand, marketplace availability and competitor pricing. Leverage predictive analytics to analyze trends and determine the optimal product cost to boost profits.

Key Features & Functionality

Customer Analytics

Track how many customers made a purchase and what percentage of those were repeats. Monitor conversion and cart abandonment rates to find anomalies.

Reporting

Drill down into data while slicing and dicing information across different dimensions, attributes and metrics. Create advanced reports to obtain valuable insights into business performance.

Product Analytics

Track how products perform and discover which items are lucrative and which ones hurt the revenue. Analyze key metrics such as quantity sold, revenue, profit margin and more relative to time.

Sales Analytics

Track different sales metrics, including revenue, refunds, discounts, net profits and more. Monitor metric changes and correlations over time.

Campaign Tracking

Create digital marketing campaigns, including social media, email and more. Track marketing efforts to see the best-performing campaigns and which customers are drawn to different offers. It refines future campaigns and directs effort toward specific demographics.

Software Comparison Strategy

Keep the following points in mind while choosing an eCommerce analytics platform:

Business Objectives

Before investing in an eCommerce business intelligence solution, it’s vital to match business needs with the marketing strategy. For instance, if your business has a global presence, you will need a solution that tracks geography-wise data of visitors, page views, conversions and other metrics.

Data Volume

The data volume generated by the business depends on its size. As it grows, you’ll deal with complex transactions that need thorough analysis. It’s imperative to consider huge data volumes without hampering performance while creating or viewing reports.

User Interface

If the platform lacks an intuitive user interface, it directly impacts usage. Non-technical users should be able to create and understand complex reports and dashboards.

Advanced Analytics

The tool should empower you to collect custom and advanced data throughout the customer journey. Create ad hoc reports using the available data to make accurate decisions.

Data Sources

You should be able to analyze data from multiple sources in different formats to obtain a complete view of business performance.

Cost & Pricing Considerations

Vendors offer pay-per-user and perpetual licenses as common pricing options. Pay-per-user allows you to pay a monthly fee for each employee and a perpetual license involves paying an upfront amount.

The Most Popular Ecommerce Analytics Software

Let’s look at popular ecommerce analytics solutions:

Tableau

Access, visualize and analyze eCommerce data with an intuitive drag-and-drop interface. Leverage visual analytics capabilities to spot trends, identify opportunities and threats, and uncover hidden insights. Pull and blend information from multiple sources to create interactive dashboards and reports.

Use built-in geographic capabilities to convert location data into interactive maps. Analyze time trends via built-in time and date functions.

Tableau

Visualize data using a drag-and-drop interface.

Power BI

Gain critical business insights in real time through comprehensive dashboards. Create visuals in the form of charts, graphs and maps to interpret data. Use information to improve customer interactions, modify business plans and make accurate predictions. Share reports with team members to facilitate collaboration.

Power BI

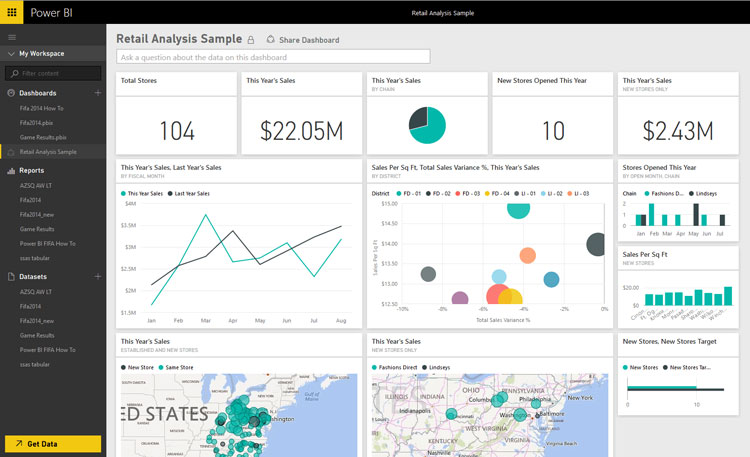
Create intuitive dashboards and reports in Power BI.

Looker

Analyze, explore and visualize data through self-service business intelligence. Drill down into data to obtain an end-to-end view of business operations. Gauge interactions across different touchpoints to better understand customer needs, boost experiences and increase revenue. Create data-rich visualizations, reports and dashboards to convey robust visual stories.

Looker

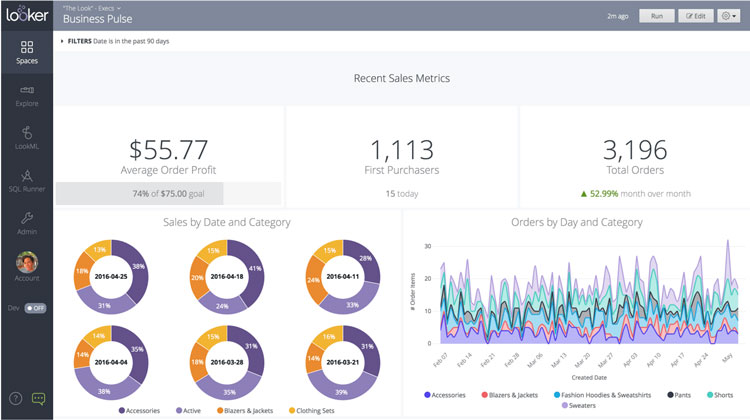
Develop rich visuals using eCommerce data in Looker.


Questions to Ask

Ecommerce Analytics Key Questions To Ask

Use these questions as a starting point for internal conversations:

  • What are your objectives?
  • What data types do you want to migrate?
  • What capabilities do you require?
  • Which deployment method should you adopt?
  • How do you cope with traffic when your business scales?

Use these questions as a starting point for conversations with the vendor:

About the Software and Vendor

  • What data sources does the software support?
  • Does it provide an intuitive user interface?
  • What is the subscription fee?
  • What is the cost of future upgrades?
  • What are the maintenance costs?
  • Which advanced features does the solution support?
  • Does it provide integration capabilities?
  • How often does the vendor release updates?
  • Does the vendor offer training?

In Conclusion

Investing in an eCommerce analytics solution personalizes customers’ experiences and offers product recommendations based on purchase or browsing histories. With artificial intelligence and machine learning capabilities, it’s possible to adjust pricing, order inventory and mitigate fraud.

Tableau

User Sentiment:
User satisfaction level icon: great

Tableau is a data visualization and analytics solution that assists enterprises in making data-driven business decisions. It blends information from a wide range of sources to deliver actionable, real-time insights. It allows exploration of data via intuitive means such as drag-and-drop filtering and natural language queries, irrespective of skill levels. With ample customization and security options, it offers control over data visualization, enabling creation of dashboards and stories that effectively convey business narratives. It can be purchased as part of the Tableau Creator package, which includes the desktop version, Prep and a Creator license of the server or online version.

PRICE
$
$
$
$
$
DEPLOYMENT
COMPANY SIZE
S
M
L
PLATFORMS

Request with no obligation:

PRICEDEMO

Power BI

User Sentiment:
User satisfaction level icon: great

Microsoft Power BI is an analytics tool that assists in reporting, data mining and data visualization to provide business insights. Through Power BI's simple interface, businesses can connect to a variety of data sources and create their own dashboards and reports. Originally born from Excel as an add-on, Power BI has since grown to stand on its own. At a relatively low cost, Power BI fulfills the needs of organizations ranging from small business owners to enterprise operators. There are three versions: Desktop, which is available for free for individual use, an upgraded Pro plan offered on a monthly price-per-user SaaS subscription and a capacity-based Premium plan which provides enterprise-level insights with on-premise deployment and a dedicated cloud infrastructure.

PRICE
$
$
$
$
$
DEPLOYMENT
COMPANY SIZE
S
M
L
PLATFORMS

Request with no obligation:

PRICEDEMO

Board

User Sentiment:
User satisfaction level icon: great

Board is a robust solution that offers analytical insights, business analytics and enterprise performance management all under the same hood. It helps key players of a company improve the effectiveness of their decision making. Its customizable and interactive dashboards give enterprises the ability to see a high-level overview of their business, as well as drill down into their KPIs to assess business performance goals. It serves mid- to large-sized companies across various industries, and its programming-free toolkit helps businesses analyze and plan with a tailored, efficient approach, irrespective of technical skill levels.

PRICE
$
$
$
$
$
DEPLOYMENT
COMPANY SIZE
S
M
L
PLATFORMS

Request with no obligation:

PRICEDEMO

Looker

User Sentiment:
User satisfaction level icon: great

Looker is a web-based analytics solution that offers businesses the ability to explore, discover, visualize and share data insights. Enterprises can view data sources and drill down into data to better understand their business and metrics. Using a simple proprietary modeling language, this system helps define data relationships while bypassing SQL. It facilitates data literacy and accessibility, irrespective of technical skill levels. It was acquired by Google on June 6, 2019, for $2.9 billion.

PRICE
$
$
$
$
$
DEPLOYMENT
COMPANY SIZE
S
M
L
PLATFORMS

Request with no obligation:

PRICEDEMO

Qlik Sense

User Sentiment:
User satisfaction level icon: great

Qlik Sense is a self-service data analytics software that enhances human intuition with the power of artificial intelligence to enable better data-driven business decisions. It allows organizations to explore their data and create intuitive and compelling visualizations from data insights with drag-and-drop simplicity. As the next-generation advancement of QlikView, released in 2014, it expands analytical possibilities to support the entire insights life cycle and helps businesses modernize their approach to intelligence. It has two editions: Business and Enterprise, offered on a per account annual subscription. Enterprises can choose between a hosted SaaS public cloud or multi-cloud, on-premise or private cloud deployment. Qlik Sense Business comes with a free 30-day trial. Its desktop version is available for free for personal use.

PRICE
$
$
$
$
$
DEPLOYMENT
COMPANY SIZE
S
M
L
PLATFORMS

Request with no obligation:

PRICEDEMO

Spark

User Sentiment:
User satisfaction level icon: great

Apache Spark is an open source unified analytics software for distributed, rapid processing. It distributes data across clusters in real time to produce market-leading speeds. It is rising in popularity in the space, catching up to its sister-offering, Hadoop, because of its quicker speeds and specific focus on optimizing processing performance and ability to stream data. It supports several coding languages, including Python, R, Scala, SQL and Java. It can function stand-alone, or be integrated into broader workflows easily.

PRICE
$
$
$
$
$
DEPLOYMENT
COMPANY SIZE
S
M
L
PLATFORMS

Request with no obligation:

PRICEDEMO

Black Knight

User Sentiment:
n/a

Black Knight offers an extensive suite of cloud-based solutions for businesses to improve decision-making through actionable data insights. It provides a unified end-to-end framework that combines its big data assets with data collection, visualization and analytics. Armed with multilingual support, machine learning techniques and an intuitive interface, it helps enterprises generate leads, adhere to compliance guidelines and increase process efficiencies.Though aimed at the mortgage and mortgage-related industry, it also offers data analytics to suit the needs of a range of other industries. Some of its industry-specific inclusions include hedge, enterprise, market and competitive analytics. Customers can opt for the origination, servicing or home equity collections, each focused on addressing specific challenges or utilize all three collections for expanded visibility.

PRICE
$
$
$
$
$
DEPLOYMENT
COMPANY SIZE
S
M
L
PLATFORMS

Request with no obligation:

PRICEDEMO

QlikView

User Sentiment:
User satisfaction level icon: great

QlikView is a data discovery and customer insight platform from Qlik, a leader in the insight and intelligence space. However, it is not available for purchase any longer. Qlik Sense, Qlik’s next-generation offering, is available for new customers. It offers self-service data that can help drive decisions and generate significant ROI for technical skill level users. It’s built from the ground up to be affordable, scalable and adaptable. It can ingest data from diverse sources like big data streams, file-based data, and on-premise or cloud data. It is well-known for its data associations and relationship functionality, keeping data in context automatically. It delivers results quickly via its patented in-memory data processing module, processing data down to as little as 10% of its original size.

PRICE
$
$
$
$
$
DEPLOYMENT
COMPANY SIZE
S
M
L
PLATFORMS

Request with no obligation:

PRICEDEMO

Spotfire

User Sentiment:
User satisfaction level icon: great

TIBCO Spotfire is a complete business intelligence and data discovery platform that can perform various functions, including in-depth analysis and robust visual reporting, all powered by artificial intelligence. It offers data streaming technology, which can support insights with AI, big data integration, integration with the Internet of things (IoT) and more.

PRICE
$
$
$
$
$
DEPLOYMENT
COMPANY SIZE
S
M
L
PLATFORMS

Request with no obligation:

PRICEDEMO

Oracle Analytics Cloud

User Sentiment:
User satisfaction level icon: great

Oracle Analytics Cloud is an AI-powered solution that provides robust reporting and analytics features to businesses of all sizes. It offers a strong selection of reporting and analytics features from the convenience of the cloud. It prepares and analyzes data for trends, then turns that data into an intuitive visualization for users to explore and share. This helps users get a deeper understanding of a range of business questions as well as make accurate predictions and forecasts.

PRICE
$
$
$
$
$
DEPLOYMENT
COMPANY SIZE
S
M
L
PLATFORMS

Request with no obligation:

PRICEDEMO

Sisense

User Sentiment:
User satisfaction level icon: great

Sisense is an end-to-end data analytics platform that makes data discovery and analytics accessible to customers and employees alike via an embeddable, scalable architecture. With a back-end powered by in-chip technology, it allows analysts to blend large datasets from a variety of sources into a single cohesive database for the entire company. On the front-end, users of all technical skill levels can craft visualizations, reports and dashboards to explore and share insights that drive businesses forward. Its AI-driven, cloud-native analytics offering, Fusion, embeds into business workspaces and empowers teams to view key metrics and data insights where they work. Designed for companies of all sizes, it can be deployed on-premises, as a private cloud-hosted SaaS, as a fully managed SaaS or via a hybrid strategy. It is available via annual subscription pricing and offered in three packages: its main offering BI Analytics Teams, its embedded analytics component Product Teams and code-driven cloud analytics through Cloud Data Teams.

PRICE
$
$
$
$
$
DEPLOYMENT
COMPANY SIZE
S
M
L
PLATFORMS

Request with no obligation:

PRICEDEMO

Cognos Analytics

User Sentiment:
User satisfaction level icon: great

IBM Cognos Analytics is a self-service, web-based analytics platform which empowers users of all skill levels to explore data through reporting, data analytics, KPI monitoring, events and metrics. Reports give users the ability to not just visualize their insights, but also share them with colleagues. It integrates with Watson Analytics, which leverages IBM’s artificial intelligence and natural language processing to make insights more accessible to non-technical users. It has various components which give additional functionality, flexibility and agility when processing large sets of data.

PRICE
$
$
$
$
$
DEPLOYMENT
COMPANY SIZE
S
M
L
PLATFORMS

Request with no obligation:

PRICEDEMO

Mathematica

User Sentiment:
User satisfaction level icon: excellent

Wolfram Mathematica is a technical computing platform that can perform a wide range of computations and algorithms for mathematics and beyond. Primarily designed for research and academia, it enables users to create powerful scripts through a flexible, multi-purpose programming language. It allows users to analyze and visualize data in sophisticated ways and employ methods such as machine learning, data mining and deep learning to model and solve complicated problems. It is available in the cloud through any web browser or installable on-premises on all desktop environments. Users can purchase licenses as individuals or under group or enterprise pricing for cloud, desktop or both versions.

PRICE
$
$
$
$
$
DEPLOYMENT
COMPANY SIZE
S
M
L
PLATFORMS

Request with no obligation:

PRICEDEMO

BusinessObjects

User Sentiment:
User satisfaction level icon: great

BusinessObjects from SAP offers a variety of packages to fit businesses of all industries and sizes. It aims to reduce the cost of IT upkeep and increase responsiveness to business problems. It streamlines workloads and lets users share insights to make better business decisions.

PRICE
$
$
$
$
$
DEPLOYMENT
COMPANY SIZE
S
M
L
PLATFORMS

Request with no obligation:

PRICEDEMO

MicroStrategy

User Sentiment:
User satisfaction level icon: great

MicroStrategy is a data analytics platform that delivers actionable intelligence to organizations of all sizes. It allows users to customize data visualizations and build personalized real-time dashboards. It leverages data connectivity, machine learning and mobile access to offer users comprehensive control over their insights. Due to its ease of use and scalability, it stands out as a leader in the enterprise analytics field. Users can choose between cloud, on-premise or hybrid deployment according to their needs.

PRICE
$
$
$
$
$
DEPLOYMENT
COMPANY SIZE
S
M
L
PLATFORMS

Request with no obligation:

PRICEDEMO

Sisense For Cloud Data Teams

User Sentiment:
User satisfaction level icon: great

Formerly known as Periscope Data, Sisense for Cloud Data Teams is a data analytics software tool that integrates seamlessly with the Sisense platform, offering advanced analytics that delivers actionable insights to teams that work with data in the cloud. It provides a single, cohesive interface for users to store, organize, analyze and visualize all their data for better decision-making. It empowers users of all kinds to produce, consume and share insights intuitively together, with or without coding knowledge. Originally founded in 2012 in San Francisco, California, it was acquired by Sisense in May 2019 and rebranded in January 2020.

PRICE
$
$
$
$
$
DEPLOYMENT
COMPANY SIZE
S
M
L
PLATFORMS

Request with no obligation:

PRICEDEMO
Call SelectHub for a free 15-minute selection analysis: 1-855-850-3850

ThoughtSpot

User Sentiment:
User satisfaction level icon: great

ThoughtSpot offers analytics and insight capabilities to industries seeking a deeper understanding of their proprietary data in order to make data-driven business decisions. It focuses on giving nontechnical users access to processing and analytics, bringing the ease of a search function to enterprise-scale data analysis. It offers a powerful search engine integrated with in-memory computing for a consumer-class UI.

PRICE
$
$
$
$
$
DEPLOYMENT
COMPANY SIZE
S
M
L
PLATFORMS

Request with no obligation:

PRICEDEMO

Pentaho

User Sentiment:
User satisfaction level icon: great

Pentaho Business Analytics helps users gain insights to drive decisions and manage their data. Notable features include data visualization, dashboards, data modeling, reporting, role-based security, mobile access and a host of analytics capabilities. It serves customers of any size in all industries and can be delivered in the cloud or as an embedded implementation. It’s built on open-source principles to leverage existing data against future data and has enough to offer users of any skill level.

PRICE
$
$
$
$
$
DEPLOYMENT
COMPANY SIZE
S
M
L
PLATFORMS

Request with no obligation:

PRICEDEMO

Klipfolio

User Sentiment:
User satisfaction level icon: excellent

Klipfolio is an analytics software tool that helps users wield data intelligently and confidently by building dashboards and reports that track KPIs and monitor trends. Users can glean insights from information across the organization collected in one convenient place and deploy interactive data visualizations that they can share with ease. It is available through an annual or monthly subscription to one of four plans: Publish, Grow, Team and Team+. The number of dashboards and users allowed, as well as the data refresh rate and level of support varies depending on the pricing plan selected.

PRICE
$
$
$
$
$
DEPLOYMENT
COMPANY SIZE
S
M
L
PLATFORMS

Request with no obligation:

PRICEDEMO

RStudio

User Sentiment:
User satisfaction level icon: excellent

RStudio is an integrated development environment suite for the R programming language, synthesizing coding tools into one software tool for easier advanced data processing. Using in-memory processing, it is capable of parsing big data through integrations and connections. It is available in both open-source and commercial formats, with extra features available in the paid edition includes more sophisticated collaboration and security efforts. The free version is capable of end-to-end analytics, from API connectivity and data ingestion to visualization creation and distribution. It can be deployed standalone or on a web browser through connection to RStudio Server.

PRICE
$
$
$
$
$
DEPLOYMENT
COMPANY SIZE
S
M
L
PLATFORMS

Request with no obligation:

PRICEDEMO

Dundas BI

User Sentiment:
User satisfaction level icon: great

Dundas BI is a browser-based analytics platform built to embed from the ground up. The vendor provides single and multi-tenant deployments with access to shared, reusable content. HTML5 enables customizable visualizations and user-friendly dashboards to build reports with interactivity options to drill down into data on demand. It allows secure write-backs to the database, capturing input through custom forms, stored procedures and REST APIs. It gives businesses complete control over the data stored on their IT infrastructure. The vendor offers a 25-day free trial.

PRICE
$
$
$
$
$
DEPLOYMENT
COMPANY SIZE
S
M
L
PLATFORMS

Request with no obligation:

PRICEDEMO

Infor Birst

User Sentiment:
User satisfaction level icon: great

Infor Birst is a cloud-based analytics software tool that aims to help users discover insights without the need for analyst input. It unifies IT-managed enterprise data with user-owned data, supporting the blending of both in a top-down and bottom-up manner. It uses consistent business metrics to structure raw data into organized sets and visualizations. It helps users identify patterns and better understand their organization’s KPIs. It offers a seamless, integrated UI that allows users to perform every step of the data analysis process in a single interface, enabling a smooth experience. It can be deployed either from the cloud or self-hosted on-premise. Users can purchase it in three available formats: per-user fee, by department or business unit or by end-customer in embedded scenarios.

PRICE
$
$
$
$
$
DEPLOYMENT
COMPANY SIZE
S
M
L
PLATFORMS

Request with no obligation:

PRICEDEMO

Zoho Analytics

User Sentiment:
User satisfaction level icon: great

Zoho Analytics (formerly Zoho Reports) allows users to create visualizations and dashboards to present their data via a quick, easy, self-service model. It brings insight and analysis to an organization’s business data on-demand without needing IT assistance or data analysts through extensive automation efforts in several dimensions of the analytical process. Users can crunch huge datasets, clean and blend data, perform various analytical tasks and visualize the results in dynamic graphics to uncover insights. They can make data-informed business decisions in a stand-alone or embedded environment with support for mobile devices. It has flexible on-premise or cloud deployment models.

PRICE
$
$
$
$
$
DEPLOYMENT
COMPANY SIZE
S
M
L
PLATFORMS

Request with no obligation:

PRICEDEMO

GoodData

User Sentiment:
User satisfaction level icon: great

GoodData is a powerful, embeddable, customizable SaaS solution that combines, analyzes and visualizes the internal and external data of an organization to help businesses change the way they make decisions, with a focus on data-driven best practices. It lets users process data, analyze trends and create visualizations that present information in an easily-digestible format. Users can interpret these visualizations to draw insights and make intelligent business decisions.

PRICE
$
$
$
$
$
DEPLOYMENT
COMPANY SIZE
S
M
L
PLATFORMS

Request with no obligation:

PRICEDEMO

Domo

User Sentiment:
User satisfaction level icon: great

Domo is a cloud-based business management suite that accelerates digital transformation for businesses of all sizes. It performs both micro and macro-level analysis to provide teams with in-depth insight into their business metrics as well as solve problems smarter and faster. It presents these analyses in interactive visualizations to make patterns obvious to users, facilitating the discovery of actionable insights. Through shared key performance indicators, users can overcome team silos and work together across departments.

PRICE
$
$
$
$
$
DEPLOYMENT
COMPANY SIZE
S
M
L
PLATFORMS

Request with no obligation:

PRICEDEMO

ibi

User Sentiment:
User satisfaction level icon: great

Ibi by Information Builders offers cloud-based data and analytics platforms that empower users to turn their information into insights through robust visualization, reporting and data management. WebFOCUS is its primary offering. Flexible, configurable and scalable, it integrates data from many sources, simplifies data workflows and enables fast, easy organization and analysis of data. It allows users to make more confident data-driven decisions that drive business results.As of 2020, the vendor has announced that it will be acquired by TIBCO.

PRICE
$
$
$
$
$
DEPLOYMENT
COMPANY SIZE
S
M
L
PLATFORMS

Request with no obligation:

PRICEDEMO

Jaspersoft

User Sentiment:
User satisfaction level icon: good

Jaspersoft is a reporting and data analytics suite built around the JasperReports engine that helps businesses create seamlessly embeddable, pixel-perfect reports, dashboards and visualizations. It empowers businesses with the self-service capabilities to find answers to data questions through beautifully rendered visuals that are easy to understand and explain. Bridging the gap between insight and action, it promotes ownership of the decision-making process across organizations. It includes JasperReports Library, JasperReports Server and JasperReports Studio. The vendor also offers a cloud and microservice-embeddable reporting engine, JasperReports IO.

PRICE
$
$
$
$
$
DEPLOYMENT
COMPANY SIZE
S
M
L
PLATFORMS

Request with no obligation:

PRICEDEMO

SAS Visual Analytics

User Sentiment:
User satisfaction level icon: great

SAS Visual Analytics offers fast answers to complex questions drawn from datasets of all sizes. It provides guided exploration, interactive dashboards, smart visualizations and self-service analytics to users of all technical skill levels, promoting data literacy and visibility. Its versatile, scalable design helps users make better business decisions based on data transparency. Built on a cohesive in-memory architecture, it promotes intelligent action driven by insight.

PRICE
$
$
$
$
$
DEPLOYMENT
COMPANY SIZE
S
M
L
PLATFORMS

Request with no obligation:

PRICEDEMO

Pyramid Analytics

User Sentiment:
User satisfaction level icon: great

Pyramid Analytics offers an enterprise-grade operating system that scales smoothly from single-user to organization-wide implementation. It’s OS agnostic and can be deployed in the cloud or on-premise. It promotes data literacy by allowing different levels of users to utilize different capabilities. It is designed to support an organization’s decision workflow end-to-end from self-service analytics to forecasting.

PRICE
$
$
$
$
$
DEPLOYMENT
COMPANY SIZE
S
M
L
PLATFORMS

Request with no obligation:

PRICEDEMO

JReport

User Sentiment:
User satisfaction level icon: excellent

JReport by Logi Analytics (now discontinued) empowered companies to perform data analysis and generate reports directly from other business applications. It was scalable, customizable, fault-tolerant and worked seamlessly within other web interfaces. It integrated with any architecture and supported a range of embedding methods from the front and back ends.

PRICE
$
$
$
$
$
DEPLOYMENT
COMPANY SIZE
S
M
L
PLATFORMS

Request with no obligation:

PRICEDEMO

Izenda

User Sentiment:
User satisfaction level icon: great

Izenda (replaced by Logi Symphony) is a business intelligence product that allows users to embed reporting and analytics capabilities into other applications. It monetizes data, promotes data literacy, offers insights and sets users up to make data-driven business decisions.From ad-hoc reports to ongoing insights, this software tool offers users a flexible range of data analysis features and visualization capabilities. It was designed for both developers and end users with a modern technology stack, flexible architecture and intuitive drag-and-drop interface.

PRICE
$
$
$
$
$
DEPLOYMENT
COMPANY SIZE
S
M
L
PLATFORMS

Request with no obligation:

PRICEDEMO

Exago

User Sentiment:
User satisfaction level icon: excellent

Exago (replaced by Logi Symphony) is embeddable, flexible and scalable. It is designed for multi-tenant SaaS use and requires no additional desktop downloads or plug-ins. It offers an open API and customizable UI, giving users control and flexibility. It includes express reports, pixel-perfect reports, report formatting templates, crosstab reports, drill-down, a dashboard designer, maps, data blending and OLAP.

PRICE
$
$
$
$
$
DEPLOYMENT
COMPANY SIZE
S
M
L
PLATFORMS

Request with no obligation:

PRICEDEMO

WebFOCUS

User Sentiment:
User satisfaction level icon: great

WebFOCUS is a data analytics solution from Information Builders that helps businesses transform their data into actionable insights. Its intuitive interface makes self-service intelligence accessible to users of all skill levels. Its capabilities include dashboards, scorecards, mobile access, guided ad hoc reporting, data integrations, dynamic report distribution and much more. As of 2020, the vendor has announced that it will be acquired by TIBCO.

PRICE
$
$
$
$
$
DEPLOYMENT
COMPANY SIZE
S
M
L
PLATFORMS

Request with no obligation:

PRICEDEMO

ClearStory Data

User Sentiment:
User satisfaction level icon: great

ClearStory Data was acquired by Alteryx in 2019. Data access and analysis were once relegated to specialists, quants or statisticians. Today, competitiveness on the front lines of business is dictated by the speed of data access and the quality of informed decision-making. ClearStory Data’s end-to-end solution includes an integrated Spark-based data processing platform and an incredibly simple user application for business consumption of insights.

PRICE
$
$
$
$
$
DEPLOYMENT
COMPANY SIZE
S
M
L
PLATFORMS

Request with no obligation:

PRICEDEMO

Datorama

User Sentiment:
User satisfaction level icon: great

Datorama helps businesses handle their processing and analysis needs for data sets of any size and complexity. It is scalable and cloud-based for growth, access and convenience. Powered by Salesforce, it’s built to provide enterprise-grade intelligence and insights.

PRICE
$
$
$
$
$
DEPLOYMENT
COMPANY SIZE
S
M
L
PLATFORMS

Request with no obligation:

PRICEDEMO

BIRT

User Sentiment:
User satisfaction level icon: great

It’s an open-source project on Eclipse and is an acronym for Business Intelligence and Reporting Tools. It lets organizations extract and transform data for business analysis. Its Report Designer enables visual report-building within interactive dashboards. The runtime component executes the reports once ready. Embedded into a range of business interfaces, it enables custom design layout, data access and scripting to present report output over the web. It supports charts, crosstabs, using multiple data sources within the same report, re-using queries within reports and addition of custom code.

PRICE
$
$
$
$
$
DEPLOYMENT
COMPANY SIZE
S
M
L
PLATFORMS

Request with no obligation:

PRICEDEMO

Real People... with Data

We know selecting software can be overwhelming. You have a lot on the line and we want you to make your project a success, avoiding the pitfalls we see far too often.

As you get started with us, whether it be with Software Requirements templates, Comparing, Shortlisting Vendors or obtaining that elusive Pricing you need; know that we are here for you.

Our Market Research Analysts will take calls, and in 10 minutes, take your basic requirements and recommend you a shortlist to start with.

Narrow Down Your Solution Options Easily

close

Applying filters...

Search by what Product or Type or Software are you looking for