Best Data Analytics Software

Data analytics software is a digital tool designed to process, analyze, and derive insights from large volumes of data. It typically includes features for data integration, data cleansing, statistical analysis, and data visualization. Data analytics software helps businesses uncover patterns, trends, and correlations within their data, enabling them to make data-driven decisions, optimize operations, and gain a competitive advantage in their industry.

Buyer's Guide

Last updated on November 16th, 2023
Data Analysis Software Is All About Informed Decision-Making

Data Analytics Software BG Intro

Is your business intelligence system fast enough to analyze information as it arrives? Anything less and you risk being stuck with dated information. Picture this: it feeds your business-critical analytics processes, and the reports don’t add up. What can you do?

If you’re struggling with data management and analytics, this buyer’s guide is for you. It includes a lowdown of what data analysis software means for your business, with handy tips and tricks to succeed at platform selection.

Executive Summary

  • Data analysis software solutions are decision-support systems that derive helpful insight from organizational information.
  • Supply chain, human resources, customer services, marketing automation and accounting are key areas benefiting from data analytics platforms.
  • Data management, visualization and reporting are primary capabilities to consider when purchasing analytics tools.
  • Sophisticated calculations, natural language processing, machine learning and mobile BI are nice-to-have features.
  • User autonomy, data fabric, hybrid cloud, prescriptive analytics and automation are significant system analytics software trends.
  • Prepare a questionnaire to ask vendors about the software and their services.
What This Guide Covers:

What Is Data Analysis Software?

Data analysis software solutions are applications providing decision support to businesses by analyzing their data. Academicians and students use them for economics, social sciences and environmental studies research.

Modern BI systems analyze many data types at speed — it’s a competitive market with reduced time to insight. These tools are undoubtedly more capable and better endowed than traditional spreadsheets and tabular reports.

Big data management, interactivity and self-service BI are ubiquitous data software features. CEOs know that to stay competitive, they must allow data access to more people in the organization.

But, allowing access entails tighter data security and governance.

Which system should you buy? What are your immediate and long-term needs?

There may be issues with your end-of-month processes. Or you’re using a mishmash of tools for tasks that shouldn’t take this much heavy lifting.

And opting for piecemeal functionality might not be an option — it works well until it doesn’t. Scalability issues can put paid to your plans to patch on the desired functionality at a lower cost.

Upgrading to a new platform is a more viable solution, though choosing a tool that plugs existing gaps without breaking the bank can be nerve-wracking. Read on for handy tips.

Primary Benefits

Your organization holds oodles of data with the potential to drive success and growth.
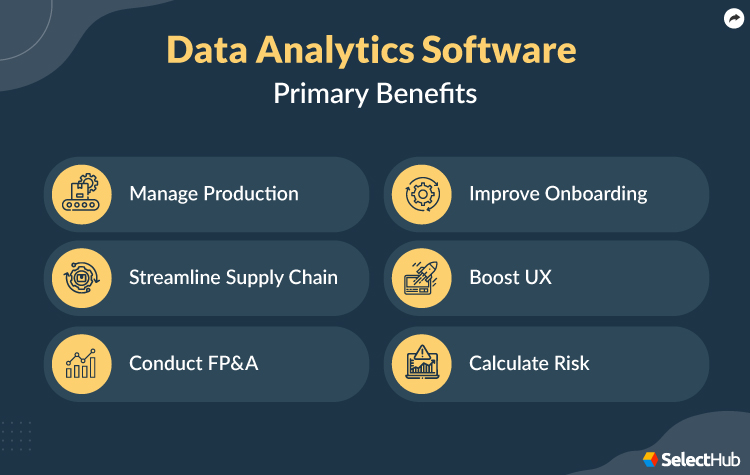
Data Analytics Software Benefits

Manage Production

Every Cheetos piece looks the same — PepsiCo makes sure of it. The food and beverage giant partnered with Microsoft to train AI models that monitor every Cheetos piece for perfect shape, size, curl and crunch, giving you value for your money.

Besides quality assurance, data drives production scheduling, resource allocation and goals tracking. Rich visualization libraries, ready-to-go dashboard templates and robust source connectivity assist in analysis and decision-making.

Streamline Supply Chain

The gut feeling doesn’t work when determining how much inventory to maintain, as a major manufacturer found. Unable to aggregate data from siloed POS (point-of-sale) systems, they were flying blind, being in the dark about how channels drove sales.

Shifting to a POS system that fed data to analytics helped them achieve record sales. But POS isn’t the only data source for inventory management.

Tracking demand and supply requires pulling data from eCommerce and sales systems. Supply chain management systems enable demand forecasting, supplier performance analysis, cost reduction and risk management.

Conduct FP&A

ERP financial management systems give accurate data on demand for financial planning and analysis (FP&A). They generate business-critical financial reports for budget and capital allocation.

Predicting revenue, cash flow and expenses sets you at an advantage — you can harness opportunities and avoid risks. It tells you when to diversify or hire more people and when to take calculated risks.

Watch this case study about how Honda uses BOARD to reduce the financial model building and budgeting cycle time.

Improve Onboarding

Hiring and nurturing talent is effort-intensive, and onboarding and training gaps can cost you when employees leave, and you need to restart the hiring process.

Managers struggle with maintaining high morale due to a lack of visibility into employee trends.

HR management software supports process improvement with hiring and employee performance data. Project management systems consume this data for resource allocation. Employee productivity metrics assist in realistic goal setting.

Boost UX

How full is your inbox with personalized emails asking you to watch this and buy that? They keep coming until one day, you open an email and click on a product that catches your eye. And just like that, you’ve entered the buying funnel.

The customer is king, and your products are only as good as what buyers say. Customer analytics drives companies to success and decides marketing budgets and campaigns. And it leads to innovation — you learn what, when and where to sell.

Calculate Risk

Risk management weighs almost as much on every business owner’s mind as earnings. Data analytics helps identify metrics and events that block your company from achieving its financial, operational and compliance goals.

With predictive analytics, you can forecast the likelihood of an adverse occurrence and the exact impact on your operations. With machine learning models, you can analyze the available data to decide the best way forward.

Implementation Goals

Clarity on stakeholder expectations at the onset helps you bat for your organization when approaching vendors.

Goal 1

Stay Competitive

  • You want consumer analytics.
  • It would be great to know when to diversify.
  • You desire the primary market share in your industry.
  • You want a data-backed roadmap.

Goal 2

Improve Performance

  • You want to track KPIs (key performance indicators).
  • You hope to plug gaps and remove inefficiencies.
  • You wish to boost morale by highlighting successes.

Goal 3

Boost Productivity

  • You want to hire best-fit employees.
  • Your staff should be able to work independently with data.
  • You want to optimize resource allocation.
  • Tracking employee performance will help realize returns on your investment.

Goal 4

Manage Big Data

  • You want real-time data from all preferred sources.
  • The system should be performant when analyzing large data volumes.

Goal 5

Streamline Operations

  • You want clear visibility into internal processes.
  • Ad hoc reporting should be possible on demand.
  • The system should generate and share focused reports with clients and internal teams.

Basic Features

Start your requirements checklist with these features.

Data Management

Built-in data preprocessing, cleansing, profiling and enrichment free you from manual data prep. Metadata indexing establishes data lineage and helps retrieve data.

Data governance is a must to maintain data integrity. Python-R libraries and statistical visualization techniques enable deep-dive analysis.

Data modeling helps identify trends by establishing source-destination mappings and dataset correlations.

Data Querying

Complex queries allow open-ended exploration of relational, OLAP, CSV, XML and website data.

In-memory analysis, parallel processing and scheduled querying accelerate insights.

Batch updates and incremental refreshes keep dashboard data up-to-date. Live connectivity is excellent if it works with your databases and query systems.

But it can be draining on sources, so some databases don’t open themselves up for a live connection. It’s advisable to ask vendors which databases respond to live queries.

Dashboarding and Data Visualization

Dashboards are single-screen KPI views open to exploration and customization. Can you make them your own by adding brand logos, styles and colors?

Check with the vendor if you can publish them on the web and allow external user access via shareable links. Which advanced features are available in visualizations?

Are data refreshes available on demand or per schedule? There may be limitations on the daily refresh frequency.

Enterprise Reporting

Reports are the best representation of analytics results and should be easy to create. Your data analytics tools should allow downloading and sharing with others as links or PDFs in chats or emails.

Advanced analytics software will let you collaborate live with your teams and clients within your reports. You should be able to conduct meaningful discussions with others by leaving comments, asking questions and tagging them within the reports.

Advanced Features & Functionality

Identify the must-have and nice-to-have features during the requirements phase. Round off your checklist with these high-end capabilities.

Advanced Analytics

Complex calculations, dataset clustering and time series analysis help you do more with data. Model import-export enriches insights beyond what your data platform can do.

Regression and what-if analysis enable anticipating trends with a fair degree of certainty.

Sentiment analysis culls valuable customer insights from feedback and survey forms, support chats and social media platforms.

Augmented Analytics

Machine learning accelerates insights by automatically selecting features for cluster analysis and algorithms to apply to the desired data.

Automation drives reusable workflows — record and run processes with one click or per schedule. Automated data prep takes the grunt work out of getting data analysis ready.

Voice searches can vary from current queries to questions about future trends.

Embedded Analytics

Interactive dashboards, professional reports and in-depth analysis within your app avoid logging in separately to a data solution.

An embedded data app quietly feeds your system, staying in the background behind your brand name.

As a vendor, a multitenant solution allows you to optimally allocate storage and computing resources. Some analytics dashboards allow triggering actions from visualizations.

Geospatial Visualization and Analysis

Mapbox, Google Maps and Bing Maps integrations allow including location data in analysis.

Additionally, web-based map servers assist in analyzing spatial file formats, provided your tool connects to them.

Geographic map searches with forward and reverse geocoding remove the need to type in addresses and coordinates.

Advanced Reporting

Login-free dashboard access allows clients to view results remotely. Extensive BI, reporting, analytics, CRM and ERP software integrations enable comprehensive insights.

Plain text searches allow data querying without SQL skills.

Current & Upcoming Trends

Big data integration drives development trends from user autonomy to cloud software, the data fabric and processing information at the edge. Machine learning and automation make business intelligence accessible and future-ready.
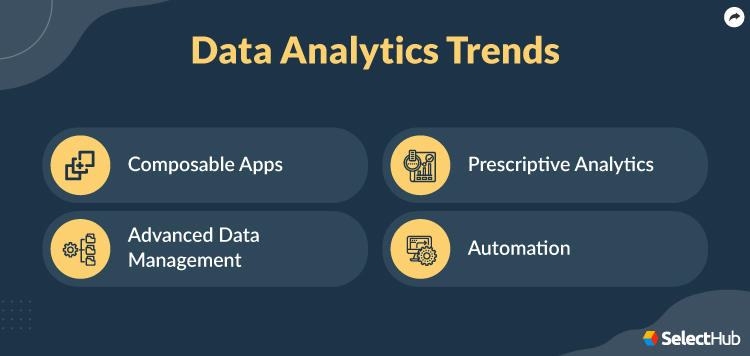
Data Analytics Software Trends

Composable Apps

With big data, analytics moved from an IT task to a core business function.

Another change was the shift from monolithic systems to composable apps. No-code software development kits allowed businesses to design modular task-centric apps they could patch onto their tech stack.

The Bayer team centralized financial insights by building a custom app with Power BI. A single-screen KPI view incorporated up to 13 critical metrics, keeping the display clutter-free with report linking.

One-click root cause analyses helped the finance team get answers without asking for help.

Flexible and scalable, composable architecture is a popular software development trend.

Advanced Data Management

Your software deployment is only as good as the data behind it. The data fabric, hybrid cloud deployments and edge analytics owe their origin to the demand for secure, real-time insight without switching apps.

Gartner recognized the data fabric as a significant data and analytics trend in 2021.

It’s a secure data-sharing network of sources and consumer applications on-premises and in the cloud.

  • A smooth transition was at the top of the mind of Lenovo’s team when scaling to a hybrid cloud architecture. Could they make the shift without impacting performance? The hardware giant developed LUCI Sky, short for Lenovo Unified Customer Intelligence, in partnership with Talend Data Fabric and AWS (Amazon Web Services). The company registered 10% ROI, with LUCI Sky running over 4,000 processes using 800 compute cores.
  • Academy Bank migrated to a hybrid cloud solution without deploying existing integrations from scratch, thanks to the Actian Data Platform. Now, customers can make payments and interact with banking services online.

Big data management technologies will continue to make waves going ahead.

Prescriptive Analytics

Machine learning algorithms can cure analysis paralysis with intelligent recommendations for future action. Techniques include finding the best-fit solution, optimization, and simulation that involves replicating scenarios to study outcomes.

Its applications include guided marketing, selling and pricing. While Netflix matches you with viewing content using a percentage-based score, eCommerce websites suggest products based on browsing and buying behavior.

Internal prescriptive insights help companies design strategy, make line-of-business decisions and position their products better. Thanks to AI and machine learning, it’s a new trend with the potential for exciting innovations.

Automation

Insight to action to new insights is a fast closed loop with many moving parts. Workflows must run like well-oiled parts of a machine, or it all falls apart. Automation is the magic mantra that makes it happen.

From reusable workflows to predictive maintenance, automation is a life-saver in business-critical scenarios. Automated workflows gather information from remote locations and send the results back to them.

Schneider Electric reduced maintenance costs and downtime by creating a predictive IoT solution using Azure Machine Learning Service.

At $20,000 per day, downtime in field maintenance doesn’t come cheap. With automated performance monitoring, Schneider’s team reduced the risks and costs associated with sending technicians to the field.

For an in-depth look at where the industry is headed, check out our Business Intelligence Trends 2023 article.

Software Comparison Strategy

If software selection seems overwhelming, a systematic approach makes it manageable.

  • Start by establishing your needs — project managers, department leaders, budget owners and power users can add value to your requirements checklist. Who are the users?
  • Visit our Jumpstart platform to compare your shortlisted products by feature, scoring them on a scale from zero to 100.
  • Conduct in-depth online research to compare shortlisted products for scalability and compatibility with existing systems. Ease of use and accessibility go a long way in encouraging platform adoption.
  • Full-feature support plans include round-the-clock assistance on business days and, in some cases, over the weekend. A dedicated assistance manager and anytime support with instant response times is worth the cost.
  • Verify if data security and regulatory compliance are available to avoid legal and operational challenges later.
  • Reach out to the topmost vendor on your list for proofs-of-concept and demos.
  • Adjust vendor ranking based on how well the products performed during demos and contact the top vendors for further discussions.

Read our lean selection methodology article to learn how to buy a suitable solution.

Cost & Pricing Considerations

Calculate the total cost of ownership (TCO) by including training and maintenance expenses in licensing fees. Small and mid-sized companies can expect to spend about $10,000 to $25,000 annually on data analytics.

Licensing Costs

Subscription models are billed monthly or annually and may include support, maintenance and updates. A Tableau Desktop subscription costs $70/month per user, while a ThoughtSpot subscription starts at $95/month.

Consumption-Based vs. Capacity-Based Pricing

Usage-based payment models calculate the consumed storage and the number of API calls or transactions, so understanding consumption slabs and charges is essential for bill tracking.

Capacity-based pricing is like a prepaid charge — there are no surprises.

A concurrent user license will allow access to a certain number of simultaneous users, while a named user license is for exclusive use by individuals in the organization.

Open-Source and Free Software

Not all open-source software is free, but integration, customization and support costs remain. Some open-source software may incur charges when bundled with other software.

  • Apache Spark has no license fees, but it’s chargeable when bundled with Cloudera, AWS and Azure.
  • KNIME desktop is free to use, but the server is chargeable annually with user and core-based licensing. The personal plan is free, while the Team plan costs 250 euros per month.

Scalability Costs

At the onset, factor in the price of hardware upgrades, additional software licenses, extra storage and network expenses into your TCO as your business expands. 

Support and Maintenance Costs

Don’t try to cut corners here. Go for round-the-clock support and faster response times if it gives you peace of mind and helps you deliver on your promises — it’s worth it.

Discounts

Some vendors sweeten the deal by offering long-term subscriptions at lower prices or free credits. Looker by Google Cloud comes with $300 worth of free credits for new users.

Additional Considerations

Watch out for hidden costs like additional hardware or paid plugins, and don’t underestimate the usefulness of free trials.

The Most Popular Data Analytics Software

Now that you know what data analytics software can do, how do you decide which product is best? Our analysts curated some of the top data analytics systems on the market. Check out our picks below!

Power BI

It’s a data analytics system with live source connectivity for ad hoc querying and reporting. Over 350 transforms are possible with the Power BI Query Editor. AutoML enables regression and predictive modeling.

Power BI relies on Microsoft SSAS for OLAP analysis. Alert setup is possible for sending reports to predefined users when the data changes. The vendor offers Power BI Embedded with Q&A and multitenancy support.

Besides mobile and location data, IoT insights are available with Azure support. You can analyze selected data points using the Quick Insights module.

Power BI

Power BI suggests visualizations for your data queries. Source

Product Overview
User Sentiment Score 88%
Analyst Rating 90
Company Size S | M | L
Pricing Information Power BI Pro is available at $9.99 per month. Refer to our Power BI Pro vs. Premium article for details.
Free Trial Info Power BI Desktop and Service are perpetually free.
Pros and Cons From User Reviews
Pros Cons
All the users reviewing self-service BI praised the platform for in-depth data exploration. About 86% of the users mentioning adoption said there was a learning curve.
Over 98% of the users citing visualization appreciated the platform’s WYSIWYG interface and customization options.  

Oracle Analytics Cloud (OAC)

With corporate dashboards and pixel-perfect reporting, OAC provides a comprehensive business view. Semantic models drive self-service insights, simplifying complex data for technical and non-technical users.

Augmented capabilities include natural language queries, machine-driven data enrichment, one-click explanations and content personalization. You can secure sensitive data with role-based access permissions.

Oracle Analytics Cloud (OAC)

Modern solutions accelerate analytics with one-click data connections.

Product Overview
User Sentiment Score 84%
Analyst Rating 87
Company Size S | M | L
Pricing Information OAC Professional costs $16 per user monthly. Source
Free Trial Info A 30-day free trial is available with a $300 cloud credit. Source
Pros and Cons From User Reviews
Pros Cons
All users discussing augmented analytics highlighted Oracle’s machine learning and automation advantages. Around 74% of the users citing pricing found the platform expensive.
All users reviewing self-service analytics appreciated Oracle’s drill-down and filtering features.  

Qlik Sense

This data analytics software solution has AI-driven data management, visualization and analysis capabilities. Artificial intelligence drives automatic data ingestion, profiling and enrichment.

Charts, graphs and animations enable visual analysis, and master lists support multiple reports. Get fast, accurate results from the Insight Advisor, and control everything centrally using the Qlik Sense Hub.

Establish live source connectivity and upload data in incremental uploads using its DirectDiscovery module. Enhance forecasting by importing predictive models from other platforms and utilizing R plugins. Qlik Sense supports custom app building.

Qlik Sense

Robust code and machine learning algorithms drive modern data analytics.

Product Overview
User Sentiment Score 85%
Analyst Rating 85
Company Size S | M | L
Pricing Information $30 per month per user
Free Trial Info The vendor offers a 30-day free trial.
Pros and Cons From User Reviews
Pros Cons
Around 86% of the users reviewing user-friendliness said the platform is intuitive. Around 86% of the users reviewing customization said they needed more personalization options.
Approximately 81% of the users mentioning deep insights praised its embedded analytics capabilities. About 86% of the users citing cost found it price-heavy with limited licensing options.

Spotfire

TIBCO’s system analytics software supports embedded analytics using a robust JavaScript framework, R packages and open-source libraries. AI enhances data preparation and visual reporting with intelligent recommendations and NLQ.

You can build apps, and advanced features include pattern recognition and anomaly detection. Location data analysis is available, and automated reporting is available. Collaboration is possible by sharing data connections and models via its library.

Spotfire

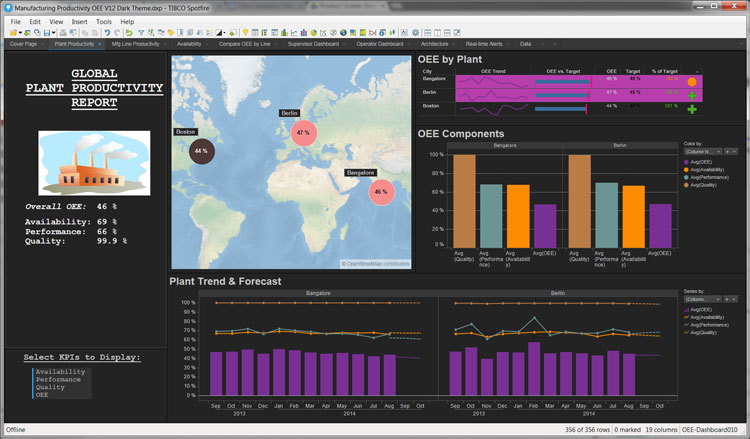
Location insights add value to analysis with click-and-zoom maps.

Product Overview
User Sentiment Score 84%
Analyst Rating 85
Company Size S | M | L
Pricing Information Available on request.
Free Trial Info A 30-day free trial is available.
Pros and Cons From User Reviews
Pros Cons
Over 91% of the users citing reporting praised the platform for automated insights. All of the users discussing the interface said it could be more intuitive.
Around 78% of users reviewing visualizations appreciated its interactive features for deep-dive analysis.  

Domo

Domo is a cloud solution for advanced analytics with segmentation, cohort analysis, clustering and what-if scenario capabilities. The vendor provides prebuilt apps for sales, marketing and data science.

Domo cards are individual dashboard tiles, and the Beast Mode enables complex calculations. The platform has an active user community, Dojo. A Windows-based workbench allows data integration from on-premise systems to the cloud.

Domo

View performance and forecast sales for the next period on a single dashboard.

Product Overview
User Sentiment Score 87%
Analyst Rating 83
Company Size S | M | L
Pricing Information Available on request.
Free Trial Info A 30-day free trial is available.
Pros and Cons From User Reviews
Pros Cons
All users reviewing functionality praised the platform for KPI monitoring.
About 95% of the users mentioning pricing found the platform cost-prohibitive.
Over 93% of the users citing visualization appreciated the platform’s data representation capabilities.  

Questions To Ask Yourself

To better understand your company’s requirements, ask these questions internally.

  • What challenges do we face with our current system?
  • Which are the must-have features?
  • Who will use the software?
  • Do we have the technical resources to deploy and maintain the new system?
  • Which system integrations are essential?

Data Analytics Key Questions To Ask


Questions to Ask Vendors

Ask these questions to learn about the software and vendor.

About the software

  • Is the software customizable?
  • What are its core strengths?
  • Is it regulation-compliant?

About the vendor

  • How many years of expertise do you have in the industry?
  • What onboarding support and training do you offer?
  • How does your support team handle help requests?

Next Steps

Data analytics software offers business-critical decision support beyond reporting to enable open-ended data exploration. Intuitive technologies like machine learning and natural language querying do the rest.

Don’t settle for anything less than what’s best for you — take the next step. Get our requirements template to list your business needs and start your software search systematically.

Product Comparisons

Additional Resources

Hadoop

User Sentiment:
User satisfaction level icon: great

Apache Hadoop is an open source framework for dealing with large quantities of data. It’s considered a landmark group of products in the business intelligence and data analytics space, and is comprised of several different components. It functions on basic analytics principles like distributed computing, large data processing, machine learning and more. Hadoop is part of a growing family of free, open source software (FOSS) projects from the Apache Foundation, and works well in conjunction with other third-party products.

PRICE
$
$
$
$
$
DEPLOYMENT
COMPANY SIZE
S
M
L
PLATFORMS

Request with no obligation:

PRICEDEMO

Tableau Big Data

User Sentiment:
User satisfaction level icon: great

Tableau is a data visualization platform that can perform big data analytics. Users can leverage well-known frameworks such as Apache Hadoop, Spark and NoSQL databases to meet their data needs. It simplifies the management, sorting and analysis of information through a single, digestible dashboard. Businesses can incorporate data from all sources and visualize it in a myriad of ways to acquire insights. The vendor offers three versions — Tableau Online, Tableau Desktop and Tableau Server.

PRICE
$
$
$
$
$
DEPLOYMENT
COMPANY SIZE
S
M
L
PLATFORMS

Request with no obligation:

PRICEDEMO

Board

User Sentiment:
User satisfaction level icon: great

Board is a robust solution that offers analytical insights, business analytics and enterprise performance management all under the same hood. It helps key players of a company improve the effectiveness of their decision making. Its customizable and interactive dashboards give enterprises the ability to see a high-level overview of their business, as well as drill down into their KPIs to assess business performance goals. It serves mid- to large-sized companies across various industries, and its programming-free toolkit helps businesses analyze and plan with a tailored, efficient approach, irrespective of technical skill levels.

PRICE
$
$
$
$
$
DEPLOYMENT
COMPANY SIZE
S
M
L
PLATFORMS

Request with no obligation:

PRICEDEMO

Domo

User Sentiment:
User satisfaction level icon: great

Domo is a cloud-based business management suite that accelerates digital transformation for businesses of all sizes. It performs both micro and macro-level analysis to provide teams with in-depth insight into their business metrics as well as solve problems smarter and faster. It presents these analyses in interactive visualizations to make patterns obvious to users, facilitating the discovery of actionable insights. Through shared key performance indicators, users can overcome team silos and work together across departments.

PRICE
$
$
$
$
$
DEPLOYMENT
COMPANY SIZE
S
M
L
PLATFORMS

Request with no obligation:

PRICEDEMO

Cloudera

User Sentiment:
User satisfaction level icon: great

Cloudera is a multi-environment analytics platform powered by integrated open source technologies that help users glean actionable business insights from their data, wherever it lives. With an enterprise data cloud, it puts data management at analysts’ fingertips, with the scalability and elasticity to manage any workload. It offers users transparency into the whole data lifecycle and the flexibility of customization through its open architecture. It is available on an annual subscription basis with three offerings: CDP Data Center, Enterprise Data Hub and HDP Enterprise Plus. Each edition offers different components and pricing varies based on computing power, storage space and number of nodes. The company merged with Hortonworks in 2019 to provide a comprehensive, end-to-end hybrid and multi-cloud offering.

PRICE
$
$
$
$
$
DEPLOYMENT
COMPANY SIZE
S
M
L
PLATFORMS

Request with no obligation:

PRICEDEMO

BIRT

User Sentiment:
User satisfaction level icon: great

It’s an open-source project on Eclipse and is an acronym for Business Intelligence and Reporting Tools. It lets organizations extract and transform data for business analysis. Its Report Designer enables visual report-building within interactive dashboards. The runtime component executes the reports once ready. Embedded into a range of business interfaces, it enables custom design layout, data access and scripting to present report output over the web. It supports charts, crosstabs, using multiple data sources within the same report, re-using queries within reports and addition of custom code.

PRICE
$
$
$
$
$
DEPLOYMENT
COMPANY SIZE
S
M
L
PLATFORMS

Request with no obligation:

PRICEDEMO

Zoomdata

User Sentiment:
User satisfaction level icon: excellent

Zoomdata (now discontinued) was an analytics and reporting tool that allowed users to explore and analyze large, complex datasets. It provided a simple, modern interface that maked data literacy attainable for users of all technical levels.It was designed to be scalable and embeddable through white labeling architecture. It was built on HTML5 and JavaScript, making it fully customizable. It aimed to expedite the processes of data exploration, visualization and analysis to help users make data-driven decisions.

PRICE
$
$
$
$
$
DEPLOYMENT
COMPANY SIZE
S
M
L
PLATFORMS

Request with no obligation:

PRICEDEMO

Alteryx

User Sentiment:
User satisfaction level icon: excellent

The Alteryx platform is a suite of five products offering self-service statistical, predictive and spatial data analytics to achieve enterprise, financial and industrial intelligence. It allows users to create repeatable extract-transform-load workflows, with or without a programming language. Its scalable performance and deployment options enable analysis from the enterprise to big data levels. A drag-and-drop interface enables high-speed analytics and modeling, supported by a community of model developers in the vendor’s customer base. Depending on the products selected from the suite, it can perform end-to-end BI, from data harvesting from deep data pools to automated operationalizing.

PRICE
$
$
$
$
$
DEPLOYMENT
COMPANY SIZE
S
M
L
PLATFORMS

Request with no obligation:

PRICEDEMO

Spotfire

User Sentiment:
User satisfaction level icon: great

TIBCO Spotfire is a complete business intelligence and data discovery platform that can perform various functions, including in-depth analysis and robust visual reporting, all powered by artificial intelligence. It offers data streaming technology, which can support insights with AI, big data integration, integration with the Internet of things (IoT) and more.

PRICE
$
$
$
$
$
DEPLOYMENT
COMPANY SIZE
S
M
L
PLATFORMS

Request with no obligation:

PRICEDEMO

BigQuery

User Sentiment:
User satisfaction level icon: excellent

Google BigQuery is a serverless solution that can handle large volumes of data and apply standard and sophisticated analytics techniques to deliver actionable insights to users. It comes with a number of standard and unique inclusions to help technical and non-technical users perform analysis, deliver reports, create dashboards and generate insights.

PRICE
$
$
$
$
$
DEPLOYMENT
COMPANY SIZE
S
M
L
PLATFORMS

Request with no obligation:

PRICEDEMO

MATLAB

User Sentiment:
User satisfaction level icon: excellent

MATLAB is a numerical computing and programming platform that enables users to develop and implement mathematical algorithms, create models and analyze data. Designed for engineers and scientists, it can be used for a range of purposes, including deep learning and machine learning, computational finance, image processing, predictive maintenance, IoT analytics and more. Built around its matrix-based programming language, it can help users run analyses on large data sets as well as design and rigorously test models. It is available through on-premise installation on Windows and Mac. For eligible licensees, there is also a SaaS version accessible through a web browser. Users can purchase it under a perpetual or annual license, with discounts for academic institutions. For individuals not associated with government agencies, private companies or other organizations, there is a less expensive home license for personal use. Students can purchase a student license for a version designed for coursework and academic research. Early-stage technology startups can apply for startup-friendly pricing and opportunities.

PRICE
$
$
$
$
$
DEPLOYMENT
COMPANY SIZE
S
M
L
PLATFORMS

Request with no obligation:

PRICEDEMO

Ezoic

User Sentiment:
User satisfaction level icon: great

Ezoic is an analytics-based advertisement testing and web optimization platform. It utilizes the concepts of big data and machine learning to learn how users engage with content and how to improve revenue. With deep revenue breakdowns, ad and layout testing, Google AMP converting and speed acceleration, it has several avenues for optimizing a site’s web presence and value. It links with more than 10,000 advertisement networks and is a partner with Google to maximize advertising options.

PRICE
$
$
$
$
$
DEPLOYMENT
COMPANY SIZE
S
M
L
PLATFORMS

Request with no obligation:

PRICEDEMO

SAP HANA

User Sentiment:
User satisfaction level icon: great

SAP HANA is the in-memory database for SAP’s Business Technology platform with strong data processing and analytics capabilities that reduce data redundancy and data footprint, while optimizing hardware and IT operational needs to support business in real time. Available on-premise, in the cloud and as a hybrid solution, it performs advanced analytics on live transactional data to display actionable information. With an in-memory architecture and lean data model that helps businesses access data at the speed of thought, it serves as a single source of all relevant data. It integrates with a multitude of systems and databases, including geo-spatial mapping tools, to give businesses the insights to make KPI-focused decisions.

PRICE
$
$
$
$
$
DEPLOYMENT
COMPANY SIZE
S
M
L
PLATFORMS

Request with no obligation:

PRICEDEMO

Panoply

User Sentiment:
User satisfaction level icon: great

Panoply is a fully-integrated data management platform that syncs, stores, organizes and analyzes data from many sources. It enables the use of search query language to explore data, then analyze and visualize it through its robust integration capabilities. Accessible anywhere via the cloud, it combines data warehousing, AI-powered data processing and a variety of integrations to provide a user-friendly data analysis infrastructure.

PRICE
$
$
$
$
$
DEPLOYMENT
COMPANY SIZE
S
M
L
PLATFORMS

Request with no obligation:

PRICEDEMO

GoodData

User Sentiment:
User satisfaction level icon: great

GoodData is a powerful, embeddable, customizable SaaS solution that combines, analyzes and visualizes the internal and external data of an organization to help businesses change the way they make decisions, with a focus on data-driven best practices. It lets users process data, analyze trends and create visualizations that present information in an easily-digestible format. Users can interpret these visualizations to draw insights and make intelligent business decisions.

PRICE
$
$
$
$
$
DEPLOYMENT
COMPANY SIZE
S
M
L
PLATFORMS

Request with no obligation:

PRICEDEMO

RapidMiner

User Sentiment:
User satisfaction level icon: excellent

The RapidMiner platform is a cloud-based series of data intelligence offerings, capable of all layers of a big data ecosystem. It can work with structured and unstructured data alike, preparing, blending, analyzing and visualizing it. It utilizes a code-free interface for designing big data workflows and integrations, capable of the complete data science life cycle. It can achieve top-level analytics like machine learning and predictive modeling. Its cloud deployment comes in managed or on-demand options. It has open-source and commercial versions.

PRICE
$
$
$
$
$
DEPLOYMENT
COMPANY SIZE
S
M
L
PLATFORMS

Request with no obligation:

PRICEDEMO
Call SelectHub for a free 15-minute selection analysis: 1-855-850-3850

Spark

User Sentiment:
User satisfaction level icon: great

Apache Spark is an open source unified analytics software for distributed, rapid processing. It distributes data across clusters in real time to produce market-leading speeds. It is rising in popularity in the space, catching up to its sister-offering, Hadoop, because of its quicker speeds and specific focus on optimizing processing performance and ability to stream data. It supports several coding languages, including Python, R, Scala, SQL and Java. It can function stand-alone, or be integrated into broader workflows easily.

PRICE
$
$
$
$
$
DEPLOYMENT
COMPANY SIZE
S
M
L
PLATFORMS

Request with no obligation:

PRICEDEMO

Hortonworks

User Sentiment:
User satisfaction level icon: great

Hortonworks Data Platform is an open-source data analysis and collection product from Hortonworks. It is designed to meet the needs of small, medium and large enterprises that are trying to take advantage of big data. The company was acquired by Cloudera in 2019 for $5.2 billion. HDP has a number of features that help it process large enterprise-level volumes, including multi-workload processing, batch processing, real-time processing, governance and more.

PRICE
$
$
$
$
$
DEPLOYMENT
COMPANY SIZE
S
M
L
PLATFORMS

Request with no obligation:

PRICEDEMO

Confluent

User Sentiment:
n/a

Confluent is a cloud-native data streaming platform for data storage and management. It integrates Apache Kafka with other systems and offers pre-built connectors for other sources. Users can get the most out of Kafka with real-time data flows and processing. Enterprise-grade security protects data, and automated monitoring detects potential problems. Processing is continuous, so data moves in real time and reaches the users who need it. Pipelines can be built and managed in a simple graphical interface with multiple programming languages supported.

PRICE
$
$
$
$
$
DEPLOYMENT
COMPANY SIZE
S
M
L
PLATFORMS

Request with no obligation:

PRICEDEMO

MicroStrategy

User Sentiment:
User satisfaction level icon: great

MicroStrategy is a data analytics platform that delivers actionable intelligence to organizations of all sizes. It allows users to customize data visualizations and build personalized real-time dashboards. It leverages data connectivity, machine learning and mobile access to offer users comprehensive control over their insights. Due to its ease of use and scalability, it stands out as a leader in the enterprise analytics field. Users can choose between cloud, on-premise or hybrid deployment according to their needs.

PRICE
$
$
$
$
$
DEPLOYMENT
COMPANY SIZE
S
M
L
PLATFORMS

Request with no obligation:

PRICEDEMO

QlikView

User Sentiment:
User satisfaction level icon: great

QlikView is a data discovery and customer insight platform from Qlik, a leader in the insight and intelligence space. However, it is not available for purchase any longer. Qlik Sense, Qlik’s next-generation offering, is available for new customers. It offers self-service data that can help drive decisions and generate significant ROI for technical skill level users. It’s built from the ground up to be affordable, scalable and adaptable. It can ingest data from diverse sources like big data streams, file-based data, and on-premise or cloud data. It is well-known for its data associations and relationship functionality, keeping data in context automatically. It delivers results quickly via its patented in-memory data processing module, processing data down to as little as 10% of its original size.

PRICE
$
$
$
$
$
DEPLOYMENT
COMPANY SIZE
S
M
L
PLATFORMS

Request with no obligation:

PRICEDEMO

Talend

User Sentiment:
User satisfaction level icon: great

Talend is an open-source data integration and management platform that enables big data ingestion, transformation and mapping at the enterprise level. The vendor provides cross-network connectivity, data quality and master data management in a single, unified hub – the Data Fabric. Based on industry standards like Eclipse, Java and SQL, it helps businesses create reusable pipelines – build once and use anywhere, with no proprietary lock-in.The open-source version is free, with the cloud data integration module available for a monthly and annual fee. The price of Data Fabric is available on request.

PRICE
$
$
$
$
$
DEPLOYMENT
COMPANY SIZE
S
M
L
PLATFORMS

Request with no obligation:

PRICEDEMO

Infor Birst

User Sentiment:
User satisfaction level icon: great

Infor Birst is a cloud-based analytics software tool that aims to help users discover insights without the need for analyst input. It unifies IT-managed enterprise data with user-owned data, supporting the blending of both in a top-down and bottom-up manner. It uses consistent business metrics to structure raw data into organized sets and visualizations. It helps users identify patterns and better understand their organization’s KPIs. It offers a seamless, integrated UI that allows users to perform every step of the data analysis process in a single interface, enabling a smooth experience. It can be deployed either from the cloud or self-hosted on-premise. Users can purchase it in three available formats: per-user fee, by department or business unit or by end-customer in embedded scenarios.

PRICE
$
$
$
$
$
DEPLOYMENT
COMPANY SIZE
S
M
L
PLATFORMS

Request with no obligation:

PRICEDEMO

KNIME

User Sentiment:
User satisfaction level icon: great

KNIME is an open-source end-to-end data analytics solution. It utilizes visual workflows with drag-and-drop functionality and thousands of nodes to lessen the data analytics learning curve data, with more than 1,800 prebuilt default workflows for streamlined setup. It allows for data ingestion, preparing, cleansing, analyzing and visualizing. It can be scaled for deeper analytics through integrations with sophisticated data modeling capabilities. It can be hosted on-premise or in the cloud through Microsoft Azure.

PRICE
$
$
$
$
$
DEPLOYMENT
COMPANY SIZE
S
M
L
PLATFORMS

Request with no obligation:

PRICEDEMO

Airflow

User Sentiment:
User satisfaction level icon: great

Airflow is an open-source Python framework that allows authoring, scheduling and monitoring of complex data sourcing tasks for big data pipelines. Aligned with the DevOps mantra of “Configuration as Code,” it allows developers to orchestrate workflows and programmatically handle execution dependencies such as job retries and alerting. Through the use of Directed Acyclic Graphs (DAGs), developers can customize pipeline processes as needed by using multi-step workflows. They can run part of the workflow at any time, even when tasks are being updated in real time. Besides out-of-the-box integrations with MySQL, Microsoft Server and SaaS platforms, it also provides custom connections to plugins. Robust and flexible, it is free to download for all users.

PRICE
$
$
$
$
$
DEPLOYMENT
COMPANY SIZE
S
M
L
PLATFORMS

Request with no obligation:

PRICEDEMO

Vertica

User Sentiment:
User satisfaction level icon: great

Vertica is an analytics and data exploration platform designed to ingest massive quantities of data, parse it, and then return business insights as reports and interactive graphics. Elastically scalable, it provides batch as well as streaming analytics with massively parallel processing, ANSI-compliant SQL querying and ACID transactions. Deployable in the cloud, on-premise, on Apache Hadoop and as a hybrid model, its resource manager enables concurrent job runs with reduced CPU and memory usage and data compression for storage optimization. A serverless setup and advanced data trawling techniques help users store and access their data with ease.

PRICE
$
$
$
$
$
DEPLOYMENT
COMPANY SIZE
S
M
L
PLATFORMS

Request with no obligation:

PRICEDEMO

Qlik Sense

User Sentiment:
User satisfaction level icon: great

Qlik Sense is a self-service data analytics software that enhances human intuition with the power of artificial intelligence to enable better data-driven business decisions. It allows organizations to explore their data and create intuitive and compelling visualizations from data insights with drag-and-drop simplicity. As the next-generation advancement of QlikView, released in 2014, it expands analytical possibilities to support the entire insights life cycle and helps businesses modernize their approach to intelligence. It has two editions: Business and Enterprise, offered on a per account annual subscription. Enterprises can choose between a hosted SaaS public cloud or multi-cloud, on-premise or private cloud deployment. Qlik Sense Business comes with a free 30-day trial. Its desktop version is available for free for personal use.

PRICE
$
$
$
$
$
DEPLOYMENT
COMPANY SIZE
S
M
L
PLATFORMS

Request with no obligation:

PRICEDEMO

IBM Watson Analytics

User Sentiment:
User satisfaction level icon: great

IBM Watson is an AI-augmented data science solution that enables employees to harness the power of proprietary data, unlock its potential and apply insights gained from it in new ways. It offers a wide variety of customizable modules for lifecycle management, data applications, APIs and industry-focused specializations.

PRICE
$
$
$
$
$
DEPLOYMENT
COMPANY SIZE
S
M
L
PLATFORMS

Request with no obligation:

PRICEDEMO

Qubole

User Sentiment:
User satisfaction level icon: great

Qubole is a cloud-based data lake management solution that enables fast data lake adoption for businesses. It allows continuous collaboration by ingesting and processing continuously generated data. Connect to a variety of structured and unstructured data sources and perform ad hoc and streaming analytics, build and test machine learning models and explore data.Explore, build, orchestrate and deliver data pipelines with ease while minimizing cost and maximizing performance. Users can choose a data format best suited to their workflow. It includes a centralized workspace, development tools, an inbuilt notebook environment and extensive integrations to provide end-to-end service with near-zero maintenance.

PRICE
$
$
$
$
$
DEPLOYMENT
COMPANY SIZE
S
M
L
PLATFORMS

Request with no obligation:

PRICEDEMO

Webgility

User Sentiment:
User satisfaction level icon: fair

Webgility is a data automation suite that enables e-commerce companies to manage multi-channel inventory. It helps online sellers focus on simplifying organizational operations, forecast inventory requirements and manage data. It also assists with tax compliance refunds. Modules include accounting, inventory management, order management, shipping and analytics. This allows users to connect expenses and revenue streams, make smarter decisions, lower expenses, and simplify accounting and bookkeeping. It has partnerships with Intuit, QuickBooks, Xero and NetSuite, along with more than 70 SaaS and hosting providers, payment processors and e-commerce vendors, including Amazon, eBay, PayPal and Shopify Payments.

PRICE
$
$
$
$
$
DEPLOYMENT
COMPANY SIZE
S
M
L
PLATFORMS

Request with no obligation:

PRICEDEMO

UniCourt

User Sentiment:
User satisfaction level icon: fair

UniCourt is a legal data-as-a-service (LDaaS) solution that provides real-time access to U.S. federal and state court records for analytics, investigations, underwriting and news reporting. Available on the web and in the cloud, it provides accurate and up-to-date information on legal entities that include lawyers, judges, parties and law firms.Private individuals as well as corporate entities can readily access and download court records either in real time through API integration or from its vast database. With case change tracking through automated alerts, it ensures that subscribers get notified when the case status changes.In addition to exporting legal documents, subscribers can collaborate on cases with clients through shared folders. It’s available for personal and enterprise use through monthly and annual subscriptions.

PRICE
$
$
$
$
$
DEPLOYMENT
COMPANY SIZE
S
M
L
PLATFORMS

Request with no obligation:

PRICEDEMO

Azure Databricks

User Sentiment:
User satisfaction level icon: great

Azure Databricks is a unified big data analytics platform that provides data management, machine learning and data science to businesses through integration with Apache Spark. Integrating with a host of data sources, it pulls data from a wide variety of sources, transforms and then analyzes it through visualizations. In addition to setting up ETL flows, it empowers enterprises to create data models for predictive analysis, forecasting and future planning. The vendor offers three workloads based on the stages of analytics workflows — Jobs Compute and Jobs Light Compute for data engineers, and the All-Purpose Compute workload for data scientists.

PRICE
$
$
$
$
$
DEPLOYMENT
COMPANY SIZE
S
M
L
PLATFORMS

Request with no obligation:

PRICEDEMO

Ayasdi

User Sentiment:
User satisfaction level icon: great

Owned by the SymphonyAI Group since 2019, Ayasdi is a machine intelligence platform that leverages statistical calculations and mathematical algorithms to deliver analytics to enterprises. It helps businesses connect the dots by segmenting complex, related datasets into groups through topological data analysis (TDA). Organizations can detect financial risk areas and fraud through automated machine learning workflows, and uncover previously undiscovered patterns and risks.Its sequential data processing and augmented analytics inclusions enable healthcare providers to create consistent patient care strategies. Running on Linux and Hadoop, it can be deployed on premises or in the cloud as a Software-as-a-Service (SaaS).

PRICE
$
$
$
$
$
DEPLOYMENT
COMPANY SIZE
S
M
L
PLATFORMS

Request with no obligation:

PRICEDEMO

Actian

User Sentiment:
User satisfaction level icon: great

Actian is a cloud data management platform that enables data integration with fully managed warehousing, transformation and analytics for enterprises. It integrates with various cloud-based and on-premise technologies and services. With massively parallel processing and data compression on the back end, its embedded analytical engine works in tandem with a robust RDBMS, complementing its computing with built-in user-defined functions to process online transactions at scale.Part of the Cloud Security Alliance, the vendor consistently updates their best practices to ensure the security of its cloud services. It offers a 30-day free trial. Pricing is available on request.

PRICE
$
$
$
$
$
DEPLOYMENT
COMPANY SIZE
S
M
L
PLATFORMS

Request with no obligation:

PRICEDEMO

1010data

User Sentiment:
User satisfaction level icon: good

1010data is a market intelligence and enterprise analytics solution that helps track consumer insights and market trends. In addition to vendor-critical insights, it provides brand performance metrics to buy-side entities. Seamlessly embeddable, it can also function as a standalone private-label option. Data scientists and statisticians leverage its integration with R to view and query data tables.It enables analytics development through its QuickApps framework. By tracking consumer spending trends and brand performance, it enables businesses to better position their products in the marketplace.

PRICE
$
$
$
$
$
DEPLOYMENT
COMPANY SIZE
S
M
L
PLATFORMS

Request with no obligation:

PRICEDEMO

Essbase

User Sentiment:
User satisfaction level icon: great

Oracle Essbase is an Online Analytical Processing provider for businesses to develop complex models of their activities that result in actionable insight. It can scale from simple ad-hoc queries to extensive, repeated multidimensional aggregations and present the results in a usable form. Through both retrospective and predictive analysis, business owners can maximize efficiency and profitability by turning data sources throughout the enterprise into usable information. It is configurable to an organization’s ongoing data needs.

PRICE
$
$
$
$
$
DEPLOYMENT
COMPANY SIZE
S
M
L
PLATFORMS

Request with no obligation:

PRICEDEMO

Real People... with Data

We know selecting software can be overwhelming. You have a lot on the line and we want you to make your project a success, avoiding the pitfalls we see far too often.

As you get started with us, whether it be with Software Requirements templates, Comparing, Shortlisting Vendors or obtaining that elusive Pricing you need; know that we are here for you.

Our Market Research Analysts will take calls, and in 10 minutes, take your basic requirements and recommend you a shortlist to start with.

Narrow Down Your Solution Options Easily

close

Applying filters...

Search by what Product or Type or Software are you looking for